| ♥ 0 |
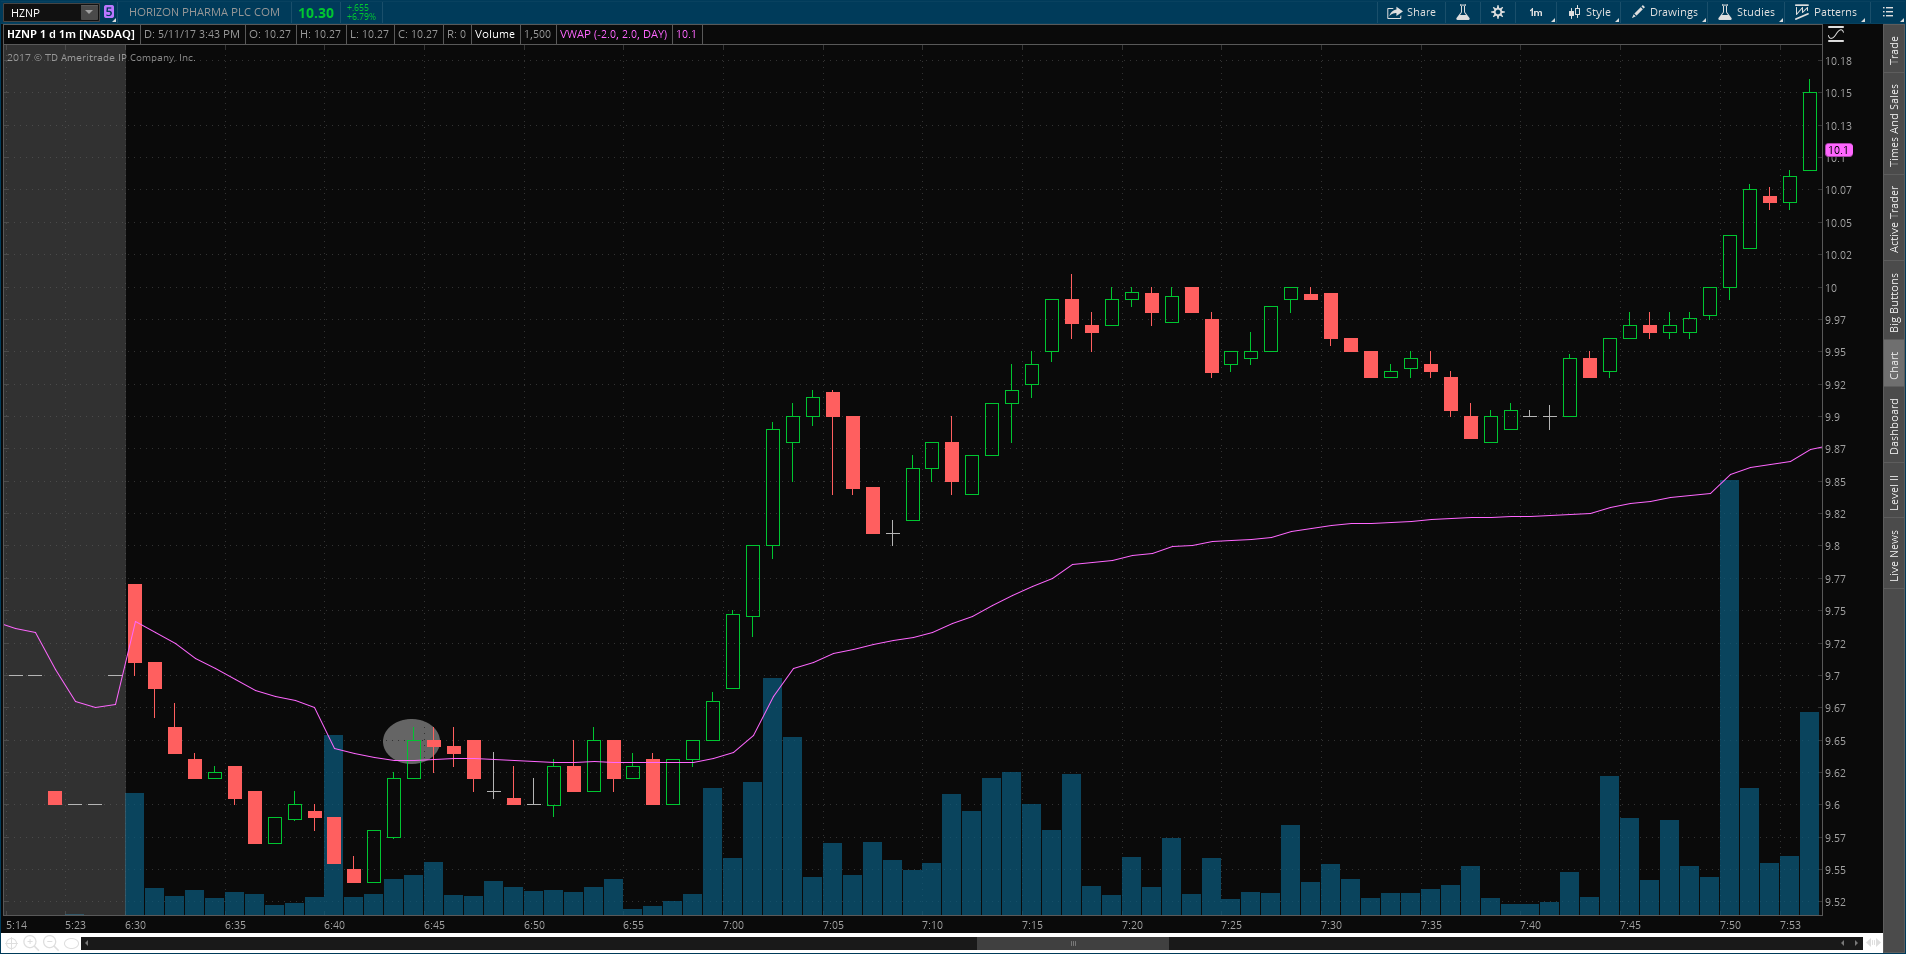
Hello Pete I am looking for a code that changes the background color of my watchlist when a green candle passes above the VWAP line on an Intraday Chart. Attachments:
Marked as spam
|
|
Private answer
I applied this to a watchlist and it appears to run very slow. Took several minutes for the data to show up. So be patient and don’t expect this to be affective at lower time frames where immediate notification is crucial. I’ll save space here by not including the source code. You can copy/paste that from the standard VWAP chart study that comes with the platform. First step, you need to remove the following lines from the very bottom of the source code:
VWAP.setDefaultColor(getColor(0)); Then you will change In the final step, you will add these two lines to the bottom of the code:
I should mention that your specification leaves a lot left to interpretation. You only asked to change the background color when a green candle crossed the VWAP. You did not mention any other conditions although the screenshot you provided appears to imply there is more. To explain further, you only marked one candle on your screenshot but there are a total of three candles that meet your specification, as stated. Marked as spam
Answered on May 12, 2017 8:02 am
|
|
|
Private answer
Ok, then we have to add quite a bit of complexity to achieve this. And I will restate my prior warning that this code takes quite some time to execute in the watchlist. Your screenshot is showing a 1 min chart and it is very doubtful the watchlist with this code will able to respond quickly enough display the signal before the 1 min bar expires. Taking from my previous example, you would remove the lines of code I previously provide and in their place you add the following:
Marked as spam
Answered on May 12, 2017 11:32 am
|
Im sorry if I was a little vague. I’m asking for the first green candle to pass the VWAP line either half or full body on the intraday chart.