Convert Fisher Scalper study to scan


Category:
0
0

Hi Pete

Just joined your forum and I have learnt a lot from your videos and codes.

I was wondering if you could help to create a scan from Fisher Scalper colour indicator bar written by George from The Lawyer Trader (http://thelawyertrader.blogspot.my/2018/04/think-or-swim-indicator-fisher-scalper.html). The code is below and would be great to have scan for bullish and bearish separately.

input price = hl2;
input length = 10;

def maxHigh = Highest(price, length);
def minLow = Lowest(price, length);
def range = maxHigh – minLow;
rec value = if IsNaN(price)
then Double.NaN
else if IsNaN(range)
then value[1]
else if range == 0
then 0
else 0.66 * ((price – minLow) / range – 0.5) + 0.67 * value[1];
def truncValue = if value > 0.99 then 0.999 else if value < -0.99 then -0.999 else value;
rec fish = 0.5 * (log((1 + truncValue) / (1 – truncValue)) + fish[1]);

plot FTOneBarBack = fish[1];
plot FT = fish;
plot ZeroLine = 0;

input emalength = 50;

plot ema2 = expAverage(fish, emalength);

FTOneBarBack.SetDefaultColor(GetColor(1));
FT.SetDefaultColor(GetColor(8));
ZeroLine.SetDefaultColor(GetColor(5));

def bullish = if ft > ema2 then 1 else 0;
def bearish = if ft < ema2 then 1 else 0;

assignpriceColor(if ft>ftonebarback and bullish then color.green else if ft>ftoneBarBack and bearish then color.blue else if ft<ftoneBarBack and bearish then color.red else if ft<ftOneBarBack and bullish then color.yellow else color.gray);

Best Regards

Ali

Marked as spam
Posted by (Questions: 6, Answers: 10)
Asked on April 26, 2018 8:18 am
51 views
0
Private answer

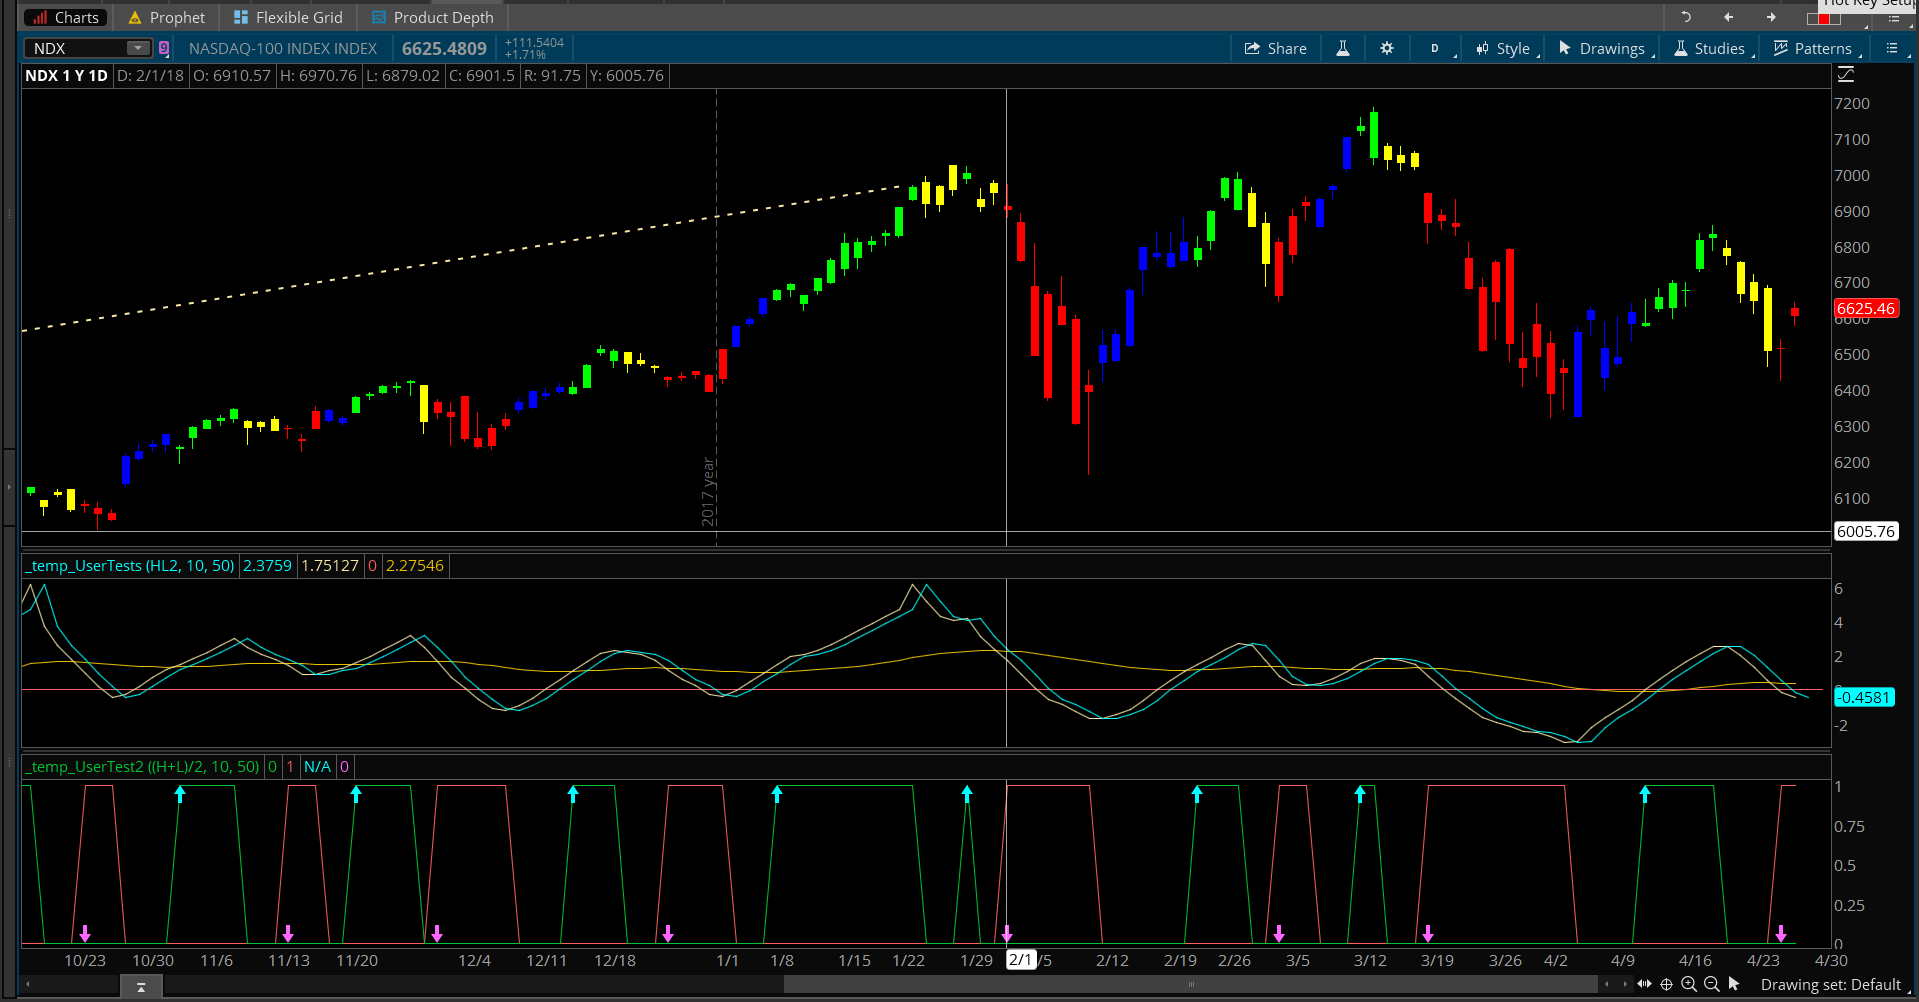
Ali, excellent post! You provided the source code and a link to the author of the code. Fantastic. I want everyone to recognize that this is how you post a very good question on the Q&A forum.

Ok, now to the solution. I have looked at the code and determined we have a couple different ways to run the scan. Take a look at the screenshot attached below. Notice the indicator paints the bars of the chart based on Bullish (GREEN) and Bearish (RED). There are other colors on there. But we’ll stick to these two since that is what is being requested.

Be sure to notice the bottom subgraph on the chart. I modified the code to plot the scan signals. I have set the colors to match the painted bars above. A value of 1 means that plot is true, a value of 0 means that plot is false (applies only to the green and red lines).

Scan Method #1

We can scan for this. So when you see a series of green colored bars, we can scan for stocks that are green, regardless of what point within the series of green bars we happen to be at the time. That is scan method number 1.

Scan Method #2

It is possible, that only the first green bar in a series is important. We scan for this too. Notice the Cyan and Magenta colored arrows in the lower subgraph. Those are the points at which the very first bullish or bearish candle is presented. These can be used for scan method number 2.

The Code

This code in the lower subgraph contains everything we need to build our scan. Since I know that folks will be asking for it, I am providing the code for that lower subgraph here:

declare lower;
input price = hl2;
input length = 10;
def maxHigh = Highest(price, length);
def minLow = Lowest(price, length);
def range = maxHigh – minLow;
rec value = if IsNaN(price) then Double.NaN else if IsNaN(range) then value[1] else if range == 0 then 0 else 0.66 * ((price – minLow) / range – 0.5) + 0.67 * value[1];
def truncValue = if value > 0.99 then 0.999 else if value < -0.99 then -0.999 else value; rec fish = 0.5 * (log((1 + truncValue) / (1 – truncValue)) + fish[1]); def FTOneBarBack = fish[1]; def FT = fish; def ZeroLine = 0; input emalength = 50; def ema2 = expAverage(fish, emalength); plot bullish = ft > ema2 and ft > ftonebarback;
bullish.SetDefaultColor(Color.GREEN);
plot bearish = ft < ema2 and ft < ftoneBarBack;
bearish.SetDefaultColor(Color.RED);
plot bullSignal = if bullish and !bullish[1] then 1 else Double.NaN;
bullSignal.SetDefaultColor(Color.CYAN);
bullSignal.SetPaintingStrategy(PaintingStrategy.ARROW_UP);
bullSignal.SetLineWeight(3);
plot bearSignal = if bearish and !bearish[1] then 0 else Double.NaN;
bearSignal.SetDefaultColor(Color.MAGENTA);
bearSignal.SetPaintingStrategy(PaintingStrategy.ARROW_DOWN);
bearSignal.SetLineWeight(3);

The Scan

Ok, now let’s present the code you will use for the scan. The changes required are minimal. We just change all the “plot” statements to “def”. Then remove all the style statements associated with those plots. Finally, we add a few lines (eight total) to scan for those signals that used to be plots.

input price = hl2;
input length = 10;
def maxHigh = Highest(price, length);
def minLow = Lowest(price, length);
def range = maxHigh – minLow;
rec value = if IsNaN(price) then Double.NaN else if IsNaN(range) then value[1] else if range == 0 then 0 else 0.66 * ((price – minLow) / range – 0.5) + 0.67 * value[1];
def truncValue = if value > 0.99 then 0.999 else if value < -0.99 then -0.999 else value; rec fish = 0.5 * (log((1 + truncValue) / (1 – truncValue)) + fish[1]); def FTOneBarBack = fish[1]; def FT = fish; def ZeroLine = 0; input emalength = 50; def ema2 = expAverage(fish, emalength); def bullish = ft > ema2 and ft > ftonebarback;
def bearish = ft < ema2 and ft < ftoneBarBack;
def bullSignal = if bullish and !bullish[1] then 1 else Double.NaN;
def bearSignal = if bearish and !bearish[1] then 0 else Double.NaN;
# use this to scan for any bullish bar within the series
plot scan = bullish;
# use this to scan for any bearish bar within the series
#plot scan = bearish;
# use this to scan for ONLY the first bullish bar within the series
#plot scan = bullSignal == 1;
# use this to scan for ONLY the first bearish bar within the series
#plot scan = bearSignal == 0;

Those of you who have watched at least 2-3 of my videos in the Thinkorswim Scans category recognize I have provided four separate scan signals in the last 8 lines of this code. You will also understand that only one of the four signals can be used at one time and you also know how to switch between them.

Lost? Here is a link to our Thinkorswim Scans category: https://www.hahn-tech.com/category/tos/scans-tos/


Attachments:
Marked as spam
Posted by (Questions: 37, Answers: 4084)
Answered on April 26, 2018 9:42 am
0

Hi Pete
it seems I have put my appreciation for your help in wrong place! sorry about that. Again many thanks for your quick reply and another excellent work.
Regards

( at April 27, 2018 8:25 am)
0

No worries. Thanks again for your participation in our Q&A forum. Looking forward to hearing from you again! Take care.

( at April 27, 2018 8:31 am)
0
Good morning Pete; In your 2 scripts for code & scan, you have a line that I do not know what it means. "input price = hl2;" would you kindly explain it's meaning, in this instance. thank you
( at August 13, 2019 9:22 am)
0
That was actually provided in the code by the author of this post. Details can be found here: http://tlc.thinkorswim.com/center/reference/thinkScript/Functions/Fundamentals/hl2.html
( at August 13, 2019 9:37 am)