| ♥ 0 |
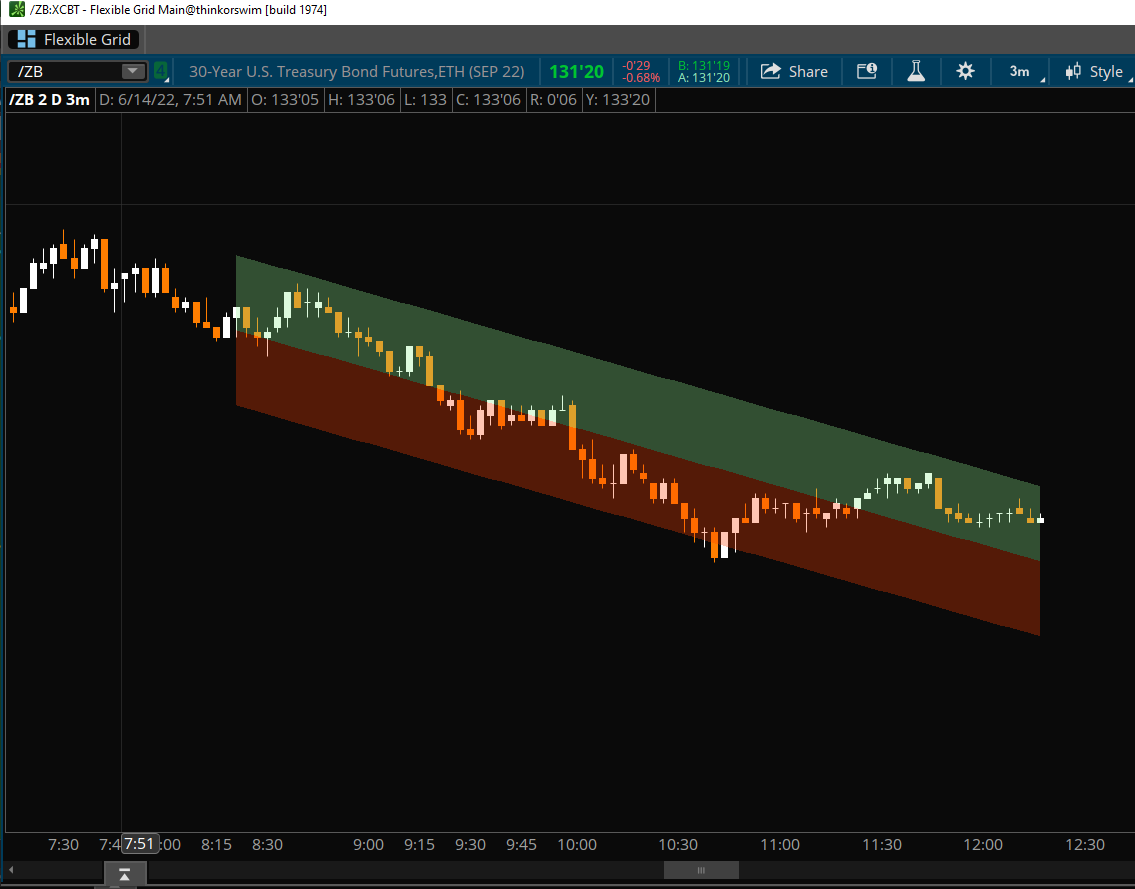
Hi Pete! I am working with an indicator in TOS that plots a linear regression channel. (photo attached + code below). I am trying to edit this script so that instead of printing a cloud, TOS instead prints a center line, a line at the top deviation, and a line at the top deviation. The cloud is obscuring other indicators that I am using so I’m hoping to replace it with just lines instead. Thanks for any tips! input price = close; def regression = InertiaAll(price, length); DefineGlobalColor(“Bullish”, Color.light_green); AddCloud(middleline, upcloud, GlobalColor(“Bullish”), GlobalColor(“Bullish”)); Attachments:
Marked as spam
|
|
Private answer
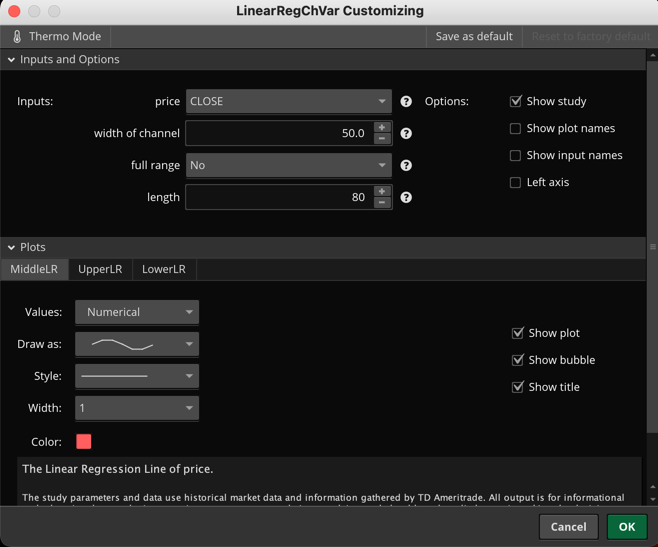
The simplest solution is to just use the built-in linear regression study included with Thinkorswim. The name of the study is "LinearRegChVar". Screenshot below shows the settings you will apply to match the default values in the code you provided with your question. But if you really wanted to do this the hard way. Simply remove the last four lines of your code and change the last three lines which remain from "def" to "plot" statements. Attachments:
Marked as spam
Answered on June 14, 2022 11:16 am
|