| ♥ 0 |
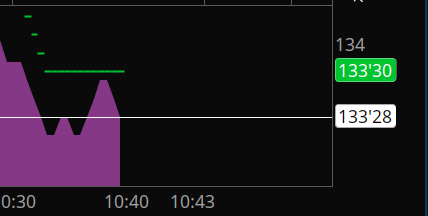
Hi Pete! The ATRTrailingstop study displays a colored bubble in the price axis which highlights the price of the current trailing stop. One color for buy and another color for sell. In the attached example (which is a 1range area chart) the current ‘trailing stop’ is the green bubble at (133’30). This matches the plotting of the ‘trailing stop’ on the chart (as green line in this case). I would like to display the price of the current stop into a watchlist. Is this possible? Thanks for any help. PS. The white bubble and line (in the attached chart) is just the last price FYI Attachments:
Marked as spam
Asked on November 17, 2022 10:06 am
44 views
|
|
Private answer
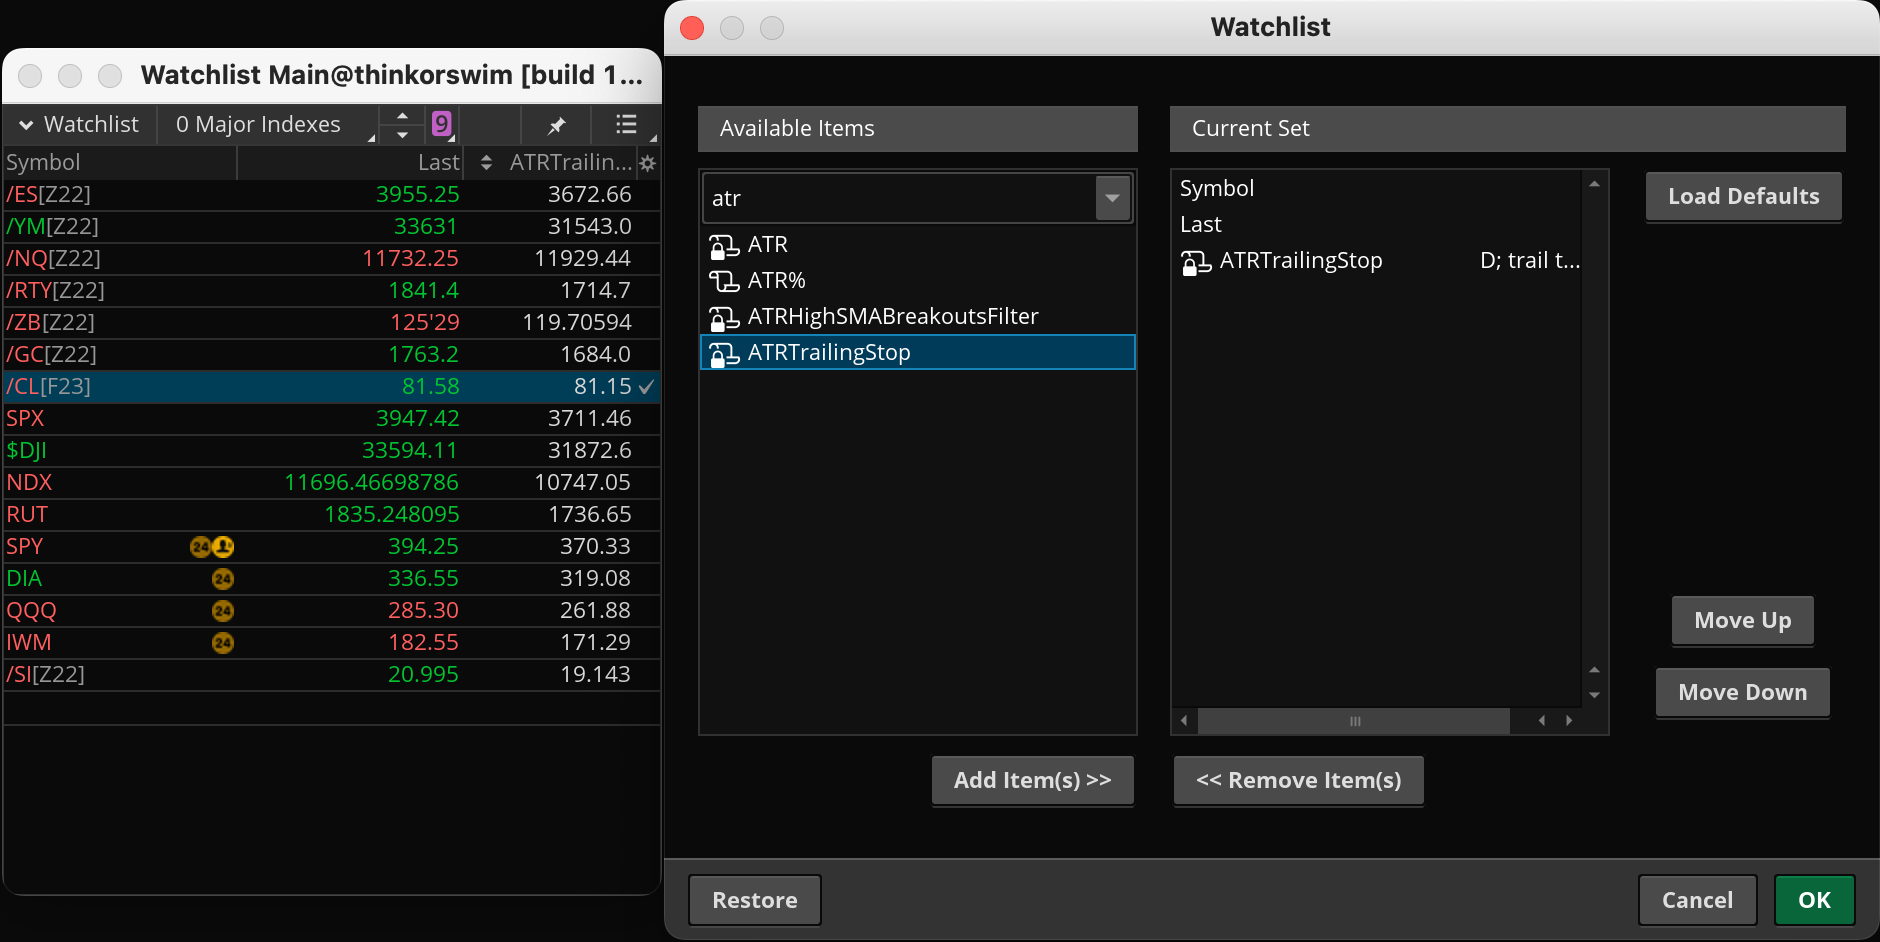
This is already included as a built-in column you can add to any watchlist gadget. Screenshot below shows how to load this and display the values on your watchlist. Attachments:
Marked as spam
Answered on November 17, 2022 10:53 am
|