| ♥ 0 |
I trade based on bars that close within a certain percentage of the close of the bar in relation to its position on the chart. How can i make automated trades based on the shapes of bars and their relationship to previous bars? I trade spikes such that the bar opens in the top 1/2 of the bar and closes in the top 1/3 of the bar with alot of space to the left. how can i create such an alert/scan/autotrade?
Marked as spam
|
|
Private answer
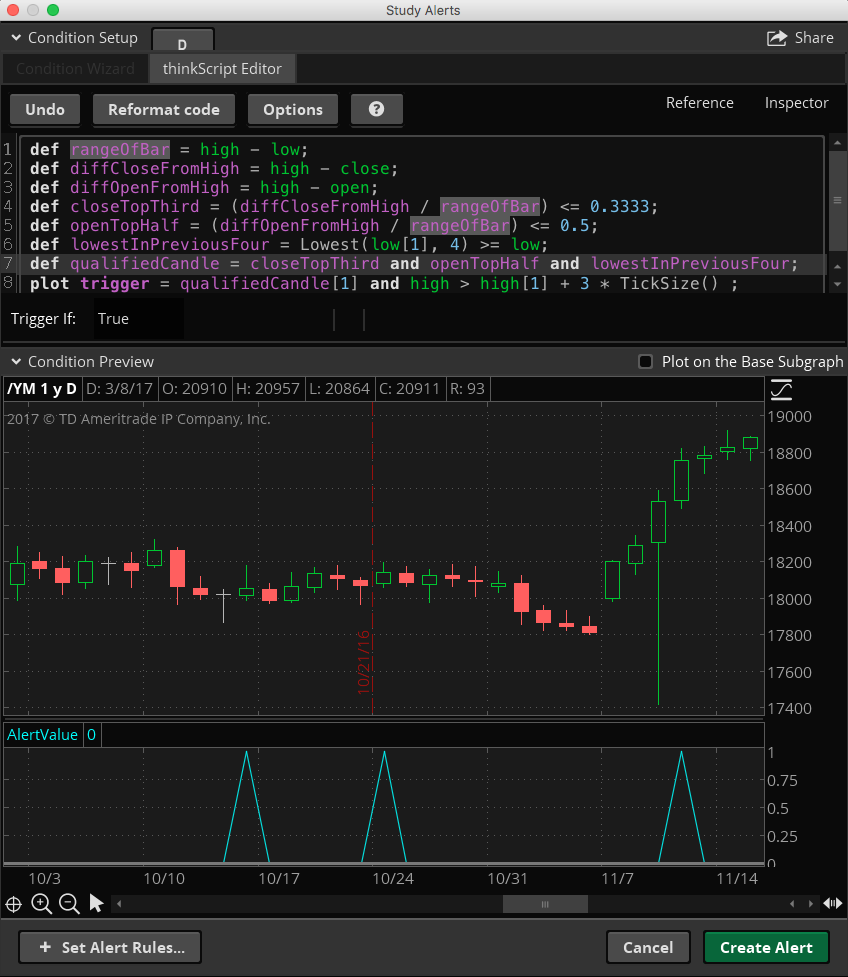
Since this was posted in the “Alerts and Notifications” topic, I will post the solution using the Study Alert tool, found in the MarketWatch tab in Thinkorswim. The same logic works in the Conditional Order Wizard and this code can be used to execute trades automatically using that tool. CAUTION!BEFORE APPLYING THIS TO A LIVE TRADE IT IS HIGHLY RECOMMENDED THAT YOU THROUGHLY TEST THIS USING THE STUDY ALERT. THEN PRACTICE APPLYING IT TO CONDITIONAL ORDERS IN PAPERMONEY. Ok, I have to say that for the sake of everyone who encounters this post in the future. Please be careful. Use of this code is at your own risk and subject to our terms and conditions: https://www.hahn-tech.com/terms-and-conditions/ Now we have that out of the way, let’s proceed. The screenshot below shows a few examples of this signal being triggered. The code is included below. I used variable names that should make it pretty easy to understand what is being done in each line. I you need adjustments or explanation just post a comment and I’ll do my best to answer. Don’t forget to up-vote any answers that best solve your question!
Attachments:
Marked as spam
Answered on March 8, 2017 9:53 am
|
|||||||
|
Private answer
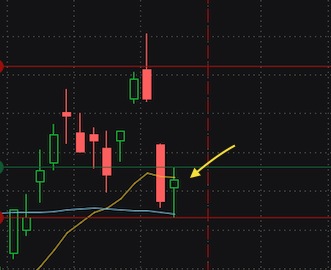
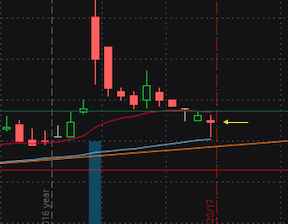
Thanks for the quick reply. Yeah, I guess it would be a hammer. I include the wicks. I know that there is a Hammer Strategy on the ToS platform, but i cant seem to make it give me a signal. 1. adjust the parameters to my 1/2 and 1/3 specifications, 2. ignore the signal unless the low of the bar is lower or equal to 4 bars of space to the left, 3. make it so the entry is a few cents above the high of the bar. I hope that is a better explanation. Attachments:
Marked as spam
Answered on March 7, 2017 10:15 pm
|
|||||||
|
Private answer
Wow! great! Ill see what i can do with it in conjunction to your other videos on how to use this kind of code. ill let you know how it goes. Marked as spam
Answered on March 8, 2017 10:52 pm
|
Please include a screenshot or two, so I can be sure I understand the specifications. I understand you have specified a candle where the open occurs in the top 1/2 and the close occurs in the top 1/3. This specification allows for an open at the high and a lower close within the top 1/3 of the candle (otherwise known as a hammer). Assuming we are including the wicks of the candle. Your phrase ”a lot of space to the left” is wide open to interpretation. Are you saying the OHLC of the candle should be higher than the highest high, several bars to it’s left? Or just the high? Or just the close….? How many bars to the left?