| ♥ 0 |
Hi Pete. I’ve searched the forum and was not able to locate a post regarding a code to mimic the MACD color in the watchlist background. If the MACD is above 0 and increasing the color would be green, if above 0 and declining it would be dark green, if below 0 and decreasing the color would be red, if below 0 and increasing the color would be dark green. Thank you so much for your help!
Marked as spam
|
|
Private answer
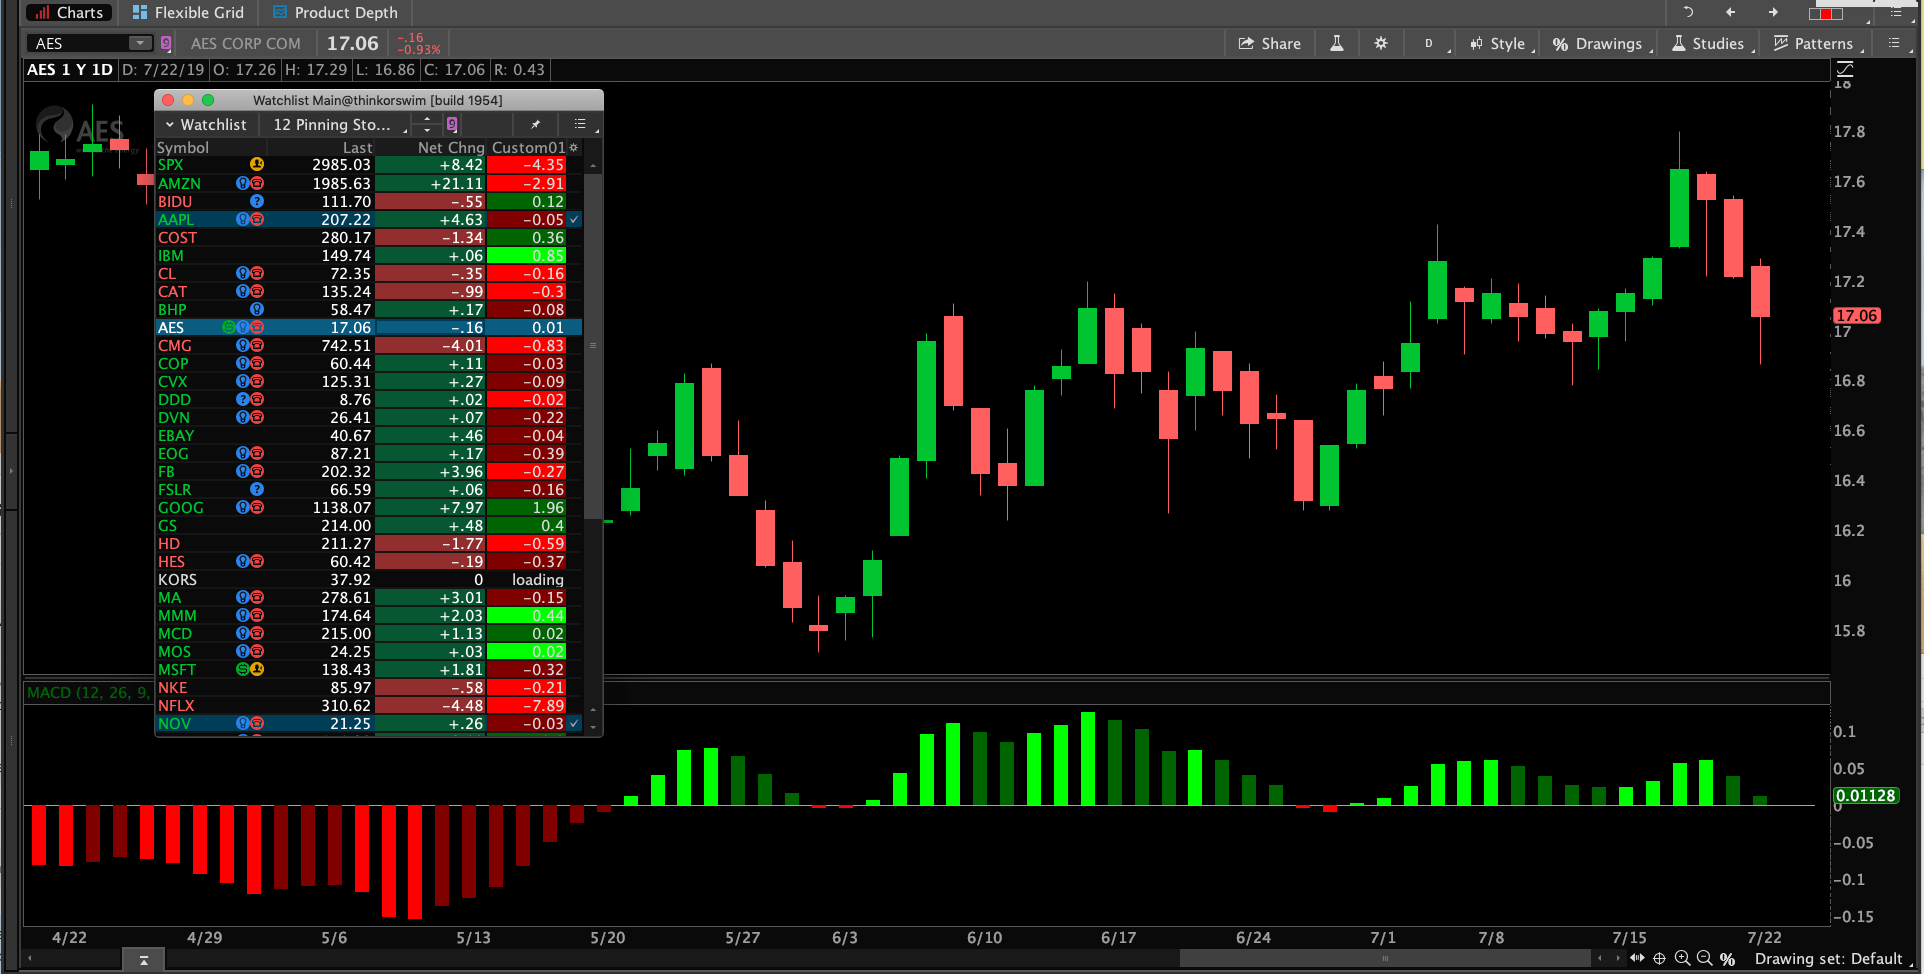
Here is the code for that. Pretty much just copied the code straight from the MACD that comes with Thinkorswim. All I did was tweak the color assignment. Screenshot below shows the result.
Attachments:
Marked as spam
Answered on July 22, 2019 2:08 pm
|