| ♥ 0 |
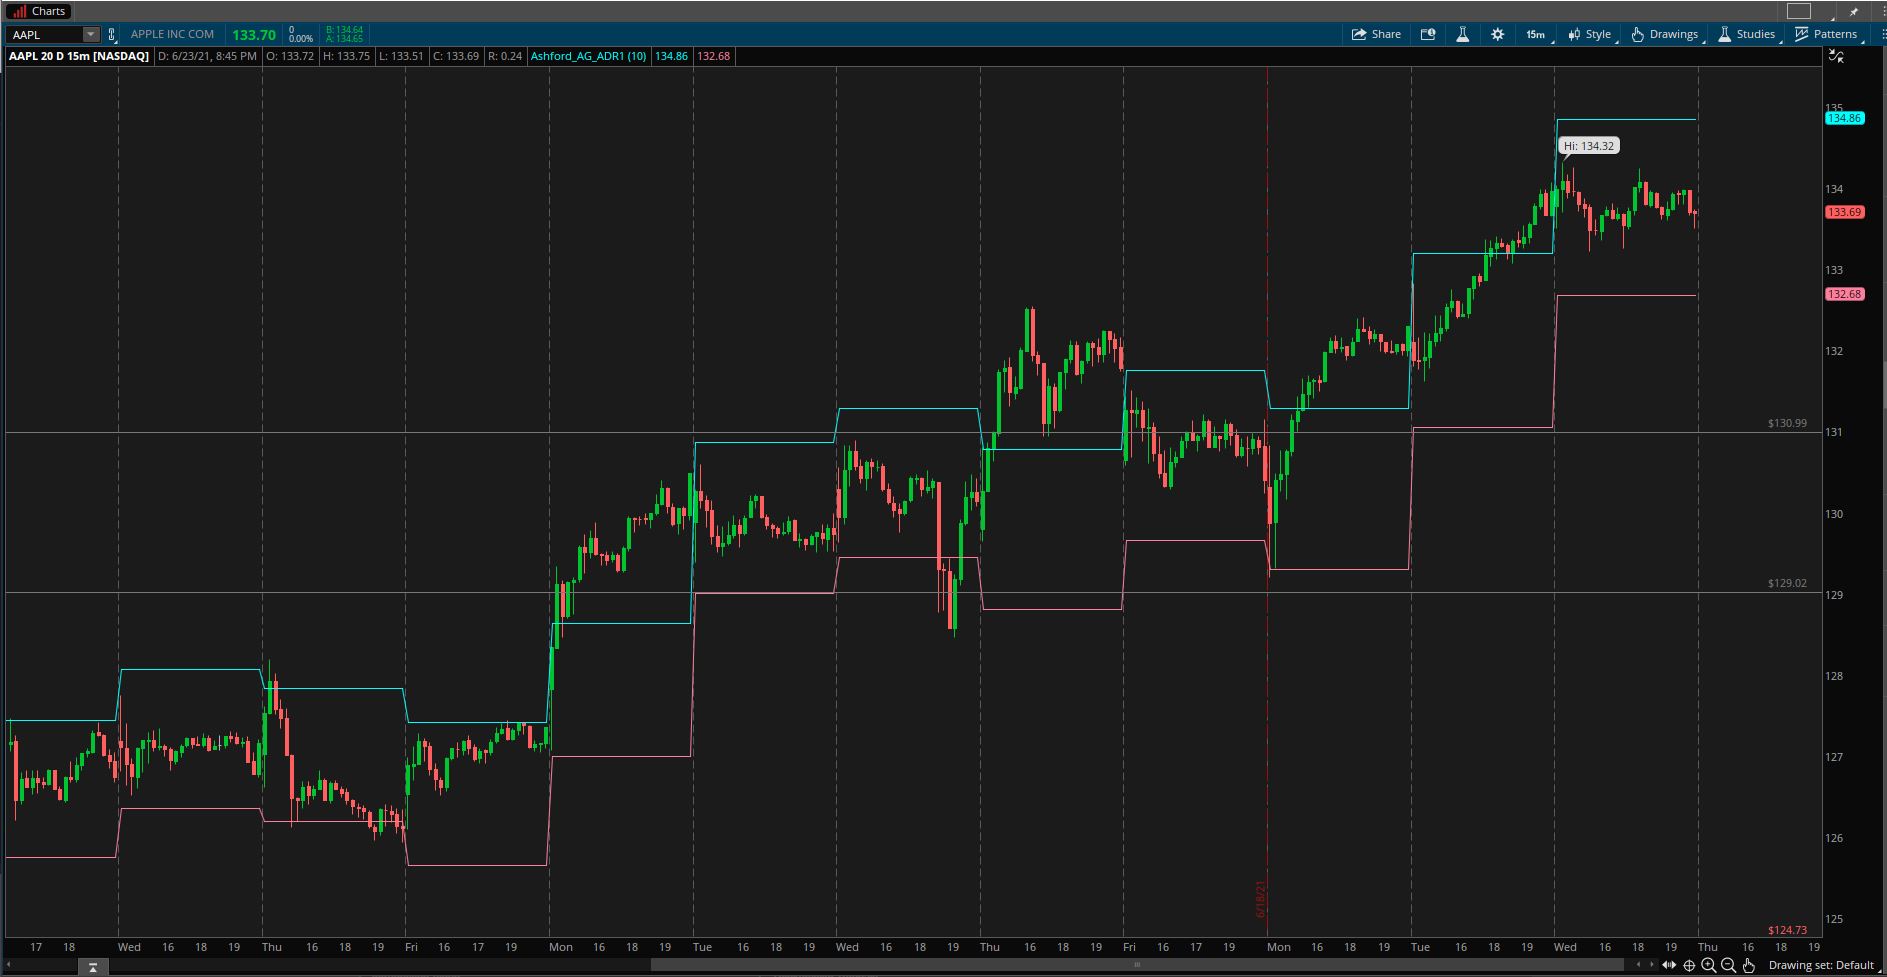
Hi Pete, Thanks for maintaining this excellent resource! Just contributed to support. I want to create a custom WL for the below study I use. It plots the 10 day avg daily range and adds / deducts the range (divided by 2) to/from the daily open price. For eg. if avg high – low range for the last 10 days is $5 and the stock opens today at $10, it adds / deducts $2.5 to / from $10. So, $7.5 and $12.5, form the lower and upper range for the day. Trying to determine which stocks in my watchlist have broken through either the high or low of that range ($7.5 and $12.5 above). This can then be shown in watchlist as %. If current price is higher, be great to have a dark green background and red background if vice-versa. Only need this for regular trading hours because range for day is defined on basis of the daily open price at 9.30am NY time. Appreciate your time Pete, thank you. Code for the study attached in txt format. Screen grab attachment shows eg. for AAPL over the past 20 days. Attachments:
Marked as spam
|
|
Private answer
Sorry but your code uses secondary aggregations and these are not supported in custom watchlist columns using the current version of Thinkorswim. There does not appear any way to reconfigure the code to comply with this limitation. Marked as spam
Answered on June 24, 2021 7:14 am
|