| ♥ 0 |
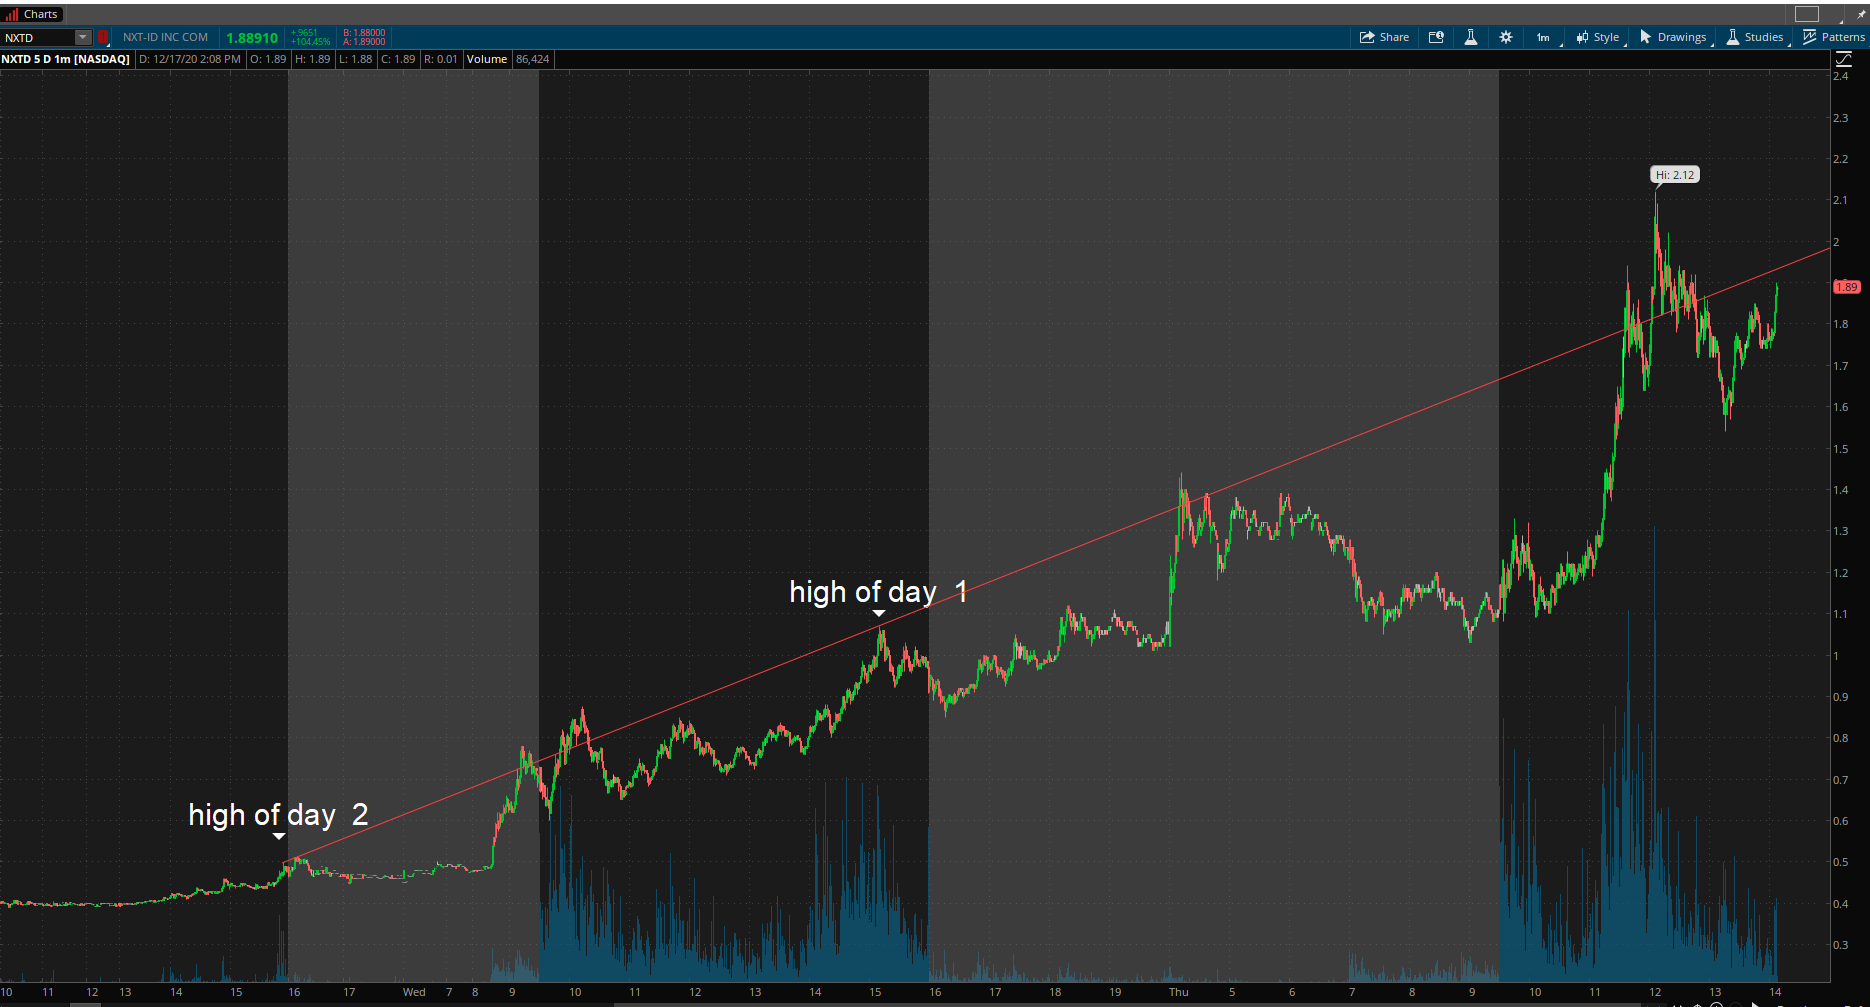
Hi Pete , how are you? I have a request, is it possible to create a study that plots a trend line form high of day 2 to high of day 1 with extension to the right? Thanks for your time. Attachments:
Marked as spam
|
|
Private answer
It is possible, except for the extension of the line to the right. Thinkorswim only allows us to write code for plot statements. In order to extended a trendline to the right would require the language give us access to create and modify drawing objects on the chart. This is not possible to accomplish in the current version of Thinkorswim. I know the next question. How can we do this without extended the line to the right. The solution is far to complex for something I can provide free of charge in the Q&A forum. Marked as spam
Answered on December 17, 2020 2:44 pm
|