| ♥ 0 |
Hello Pete, I have a scan set up to look for price to be above the ATRtrailing Stop (ATRts) on a daily and for a Fast Stochastic K to cross above the Slow D on an hourly. When this condition is met, the alert is supposed to fire, however that is not what is happening. I get alerts when the Fast K is below the Slow D and moving down for example. Sometimes the condition is met and the alert fires only to continue to alert at random many bars after the event. I’ve come to the conclusion that the alerts aren’t reliable below the daily time-frame. I’ve talked to TOS support about this and they don’t know why it is happening. I set the scan alert up per the TOS manual instructions. I have another question about the ATRts, but I’ll reserve that until after we get this fixed.
Marked as spam
|
|
Private answer
Ok, couple things I see here. First is that you are mentioning alerts for an hourly time frame that are triggering in the middle of an hourly bar. That is a sure way to get false signals. You should update your code so that it can only look at the most recently closed candle and not the current candle that is still live and subject to change. This is an absolute must, not an option. Second, you should check your chart settings. Under “Equities” tab, in the lower left there is a setting for “Start aggregations at market open”. The scan does not have this option. So guess which version the scan is using. The unchecked version. Be sure to test it yourself. The other thing I found is there is an issue with the way the signals are plotted using the “crosses above” and “is less than or equal to”. Being a coder, I never trust those in my code. I define my crosses and other conditions with purely logical operators. I tested this and I did find some bogus signals produced by your version. Here is a clean version that includes all the features I recommend. If this solves your issue, be sure up-vote the answer that best solves your issue. (and alternately, let Thinkorswim support know the link to this post)
Marked as spam
Answered on February 23, 2017 5:07 pm
|
|||
|
Private answer
I’ll try this again and see if it works. Marked as spam
Answered on February 23, 2017 9:11 am
|
|||
|
Private answer
This is the text from the ThinkScript Editor in my Scan. The time-frame for the ATRts is Daily and the time-frame for the Stochastic is 1 hour. Hope this helps, don’t know why the .png files aren’t loading.
close>ATRTrailingStop(“atr period” = 9, “atr factor” = 2.9, “average type” = “EXPONENTIAL”) Bobs_FastStoch().”FullK” crosses above BobsStoch(“k period” = 13, “d period” = 3).”SlowD” within 2 bars and Bobs_FastStoch().”FullK” <= 65 Marked as spam
Answered on February 23, 2017 9:21 am
|
|||
|
Private answer
You’re correct regarding the ATRts, I’m just looking for the daily price to be above the ATRts, then for the Stochastic to cross above. All I was doing with the custom studies was re-naming the standard studies in case I accidentally screwed something up, so I replaced my custom studies with the standard studies. It didn’t change the outcomes. Let’s see if this link works. Marked as spam
Answered on February 23, 2017 12:23 pm
|
|||
|
Private answer
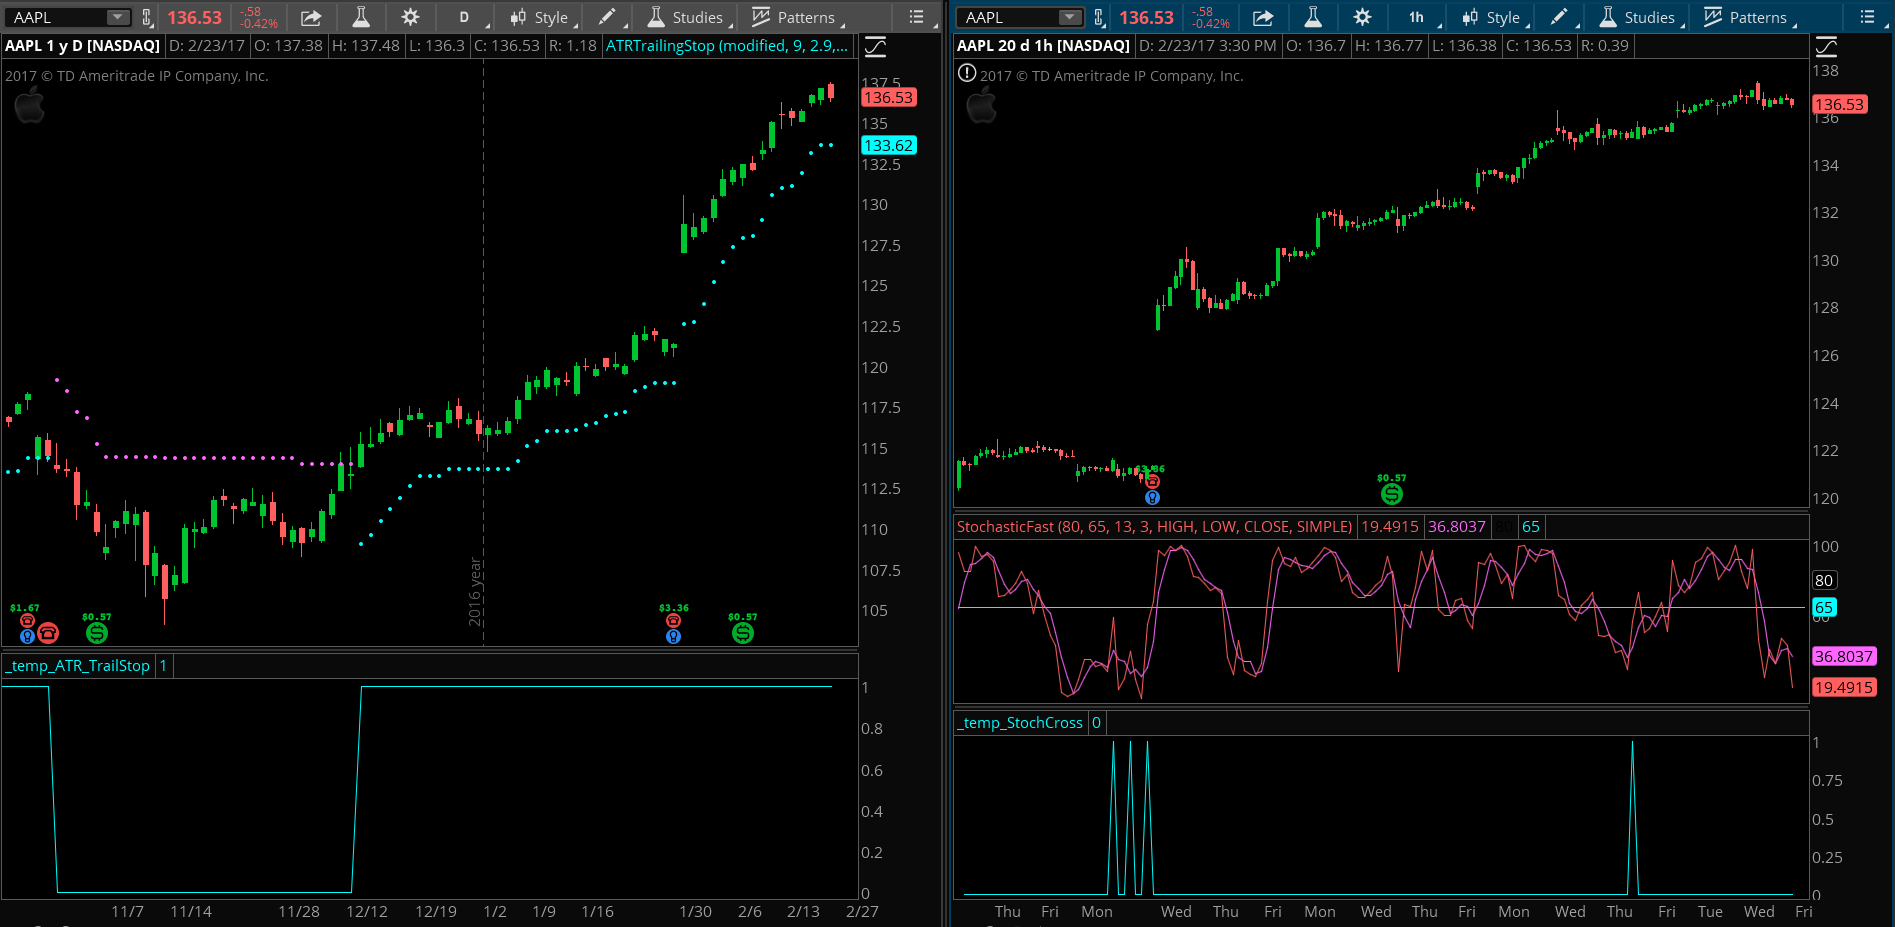
Ok, got your scan loaded and save on my platform. I have the alerts setup and will let this run during market hours tomorrow so I can see how it does. So from your description it sounds like you have no problem with the scan results, it’s the alerts that are not working as expected. Is that right? For reference, the screenshot below gives a graphic demonstration of what your scan looks like on a chart. Make sure this matches your expectations. Attachments:
Marked as spam
Answered on February 23, 2017 3:12 pm
|
|||
|
Private answer
Correct. When the alerts fire and I look at the chart, some instances are correct and others don’t make any sense. For example at 1:11pm (I’m in Phoenix) this afternoon, an alert fired for KSS (Kohls) and you can tell by looking at the 1 hour chart the stochastic never crossed. Another instance today at 12:13pm alerted that RF just fired, but upon further examination, it had actually crossed 4 bars earlier. I’ll be interested to hear what you find out tomorrow. Marked as spam
Answered on February 23, 2017 4:16 pm
|
|||
|
Private answer
Let me revise my response, upon further reflection, there is a problem with the scans. I was reviewing the scan list and there are stocks that pop-up and don’t meet the scan conditions. I think what I’ll do tomorrow is cancel the alerts and see what appears on the scan list. Maybe the alerts are doing what they are supposed to and the fault lies in the scans. Marked as spam
Answered on February 23, 2017 4:44 pm
|
|||
|
Private answer
Let’s see, where do I start. Your assessment has been spot on. First, I checked the “Start aggregation at market open” and it was fortunately checked. Next, even though being a non-coder, I was getting suspicious of the “crosses above”, which seems to make sense on the surface, but when looking at it from your side of the desk, is dubious at best. Kudos for that. After reviewing your clean version of the FastStoch, I was wondering why I had used the “Bobs_FastStoch” indicator and then when I looked at it, it appears smoother on the screen. Then it dawned on me that somewhere in the past I came across someone’s version that took out a lot of the sharp jaggedness (is that a word?) and produced fewer, but more reliable crosses. So, using your clean version I modified the scan and it is working as expected. Again, thank you for your wisdom based experience that I would not have figured out on my own. I have no doubt that you are aware of this little tidbit, but in case someone else is reading this and would like to implement this, great. I am using two monitors, so after setting up a scan that you like, save it and then go to MarketWatch. On that screen, in the upper left hand corner, click on Quotes and under that there is a drop down box. Scroll down and find your selected scan and click on it. The screen will now populate with your scan results. Now, to the right of the scroll down box, you can link the results in the window to your charts. This MarketWatch screen updates as your scan populates per your conditions, but you can’t see the charts. Now go to the upper right hand corner of this screen and you’ll see two menu icons. Select the top icon and click on Detach. Now that this screen is detached, it can be moved anywhere. I put it on the second monitor so I can see my charts on the other. If you re-size this detached screen, you can use it as a watchlist. By right-clicking on the top of the columns, you can customize the information that you want to see. The fun thing is, you don’t have to keep going back to the Scan screen to see what is going on, it’s right there and it is dynamic. Pete, I would like to take this opportunity to tell you that you are an excellent teacher and I enjoy your videos because you are logical, thorough and you don’t use redundant, fingernails on the blackboard phrases. There’s nothing like trying to listen someone who constantly uses words like, “uh”, “um”, “you know”, “like”, “okay”, etc. ad nauseum. Keep up the good work and I hope someone else reads through this as you have provided some valuable insight. Marked as spam
Answered on February 24, 2017 10:13 am
|
Sorry, but for some reason the screenshots you tried to include are not viewable. I checked the media library and the images were uploaded but they cannot be viewed. Perhaps you can use the shared workspace tool and provide a link so I can open the scan on my platform directly. Be sure your scan does not include any propriety or confidential code as this will be available to the general public.