Up and Down Arrows – Cross Above Yesterday’s high or low


Category:
0
0

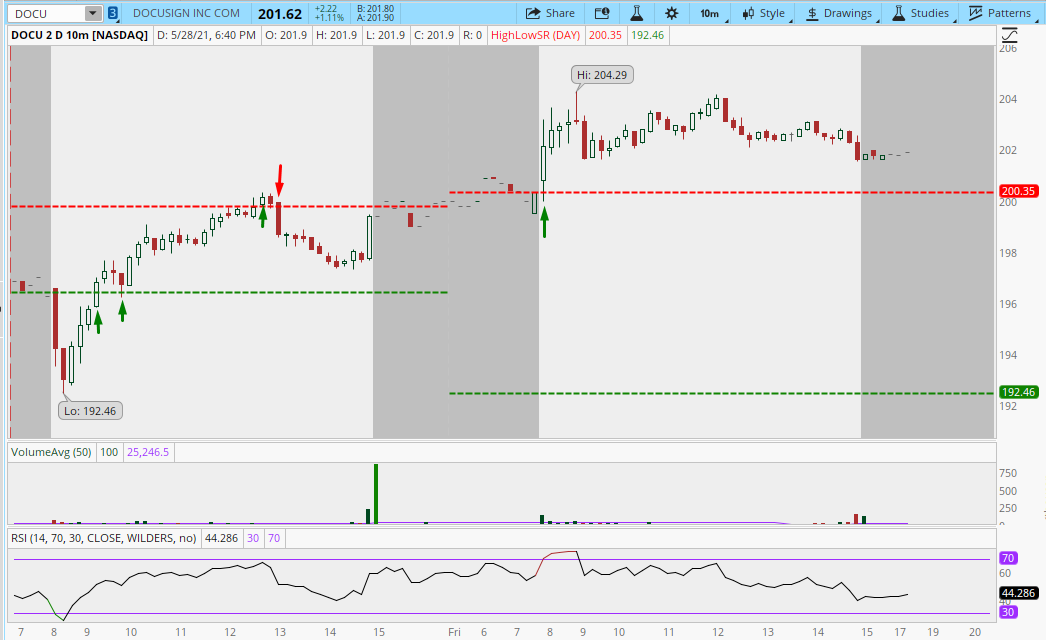
Hi Pete,

Hope you’re well! Quick question, I got the below code from browsing online which plots yesterday’s high and low onto the current intraday chart. I’m an absolute noob when it comes to TOS scripting whether it be for studies or scanners, and need your assistance with the following:

  1. How do I add Up/Down arrows for the following scenarios?
    1. Stock crosses above yesterday’s low: Up Arrow (Green)
    2. Stock crosses above yesterday’s high: Up Arrow (Green)
    3. Stock crosses below yesterday’s high: Down Arrow (Red)
    4. Stock crosses below yesterday’s low: Down Arrow (Red)

Ideally, I’d like something like the attached image. Also, how can I scan for the above scenarios? Can you please help?


Many Thanks!

Attachments:
Marked as spam
Posted by (Questions: 1, Answers: 1)
Asked on May 31, 2021 12:15 pm
119 views
0
Private answer

I can provide the code for the chart study but I do not have time to provide the scan. I only get 15 minutes for each free solution I provide in the Q&A Forum and creating the code below used up all of that time.

Important note! The chart must be set to exclude extended trading session or this will not work as designed. It is possible to provide a solution that works when extended trading session is included on the chart but that adds to the complexity and would far exceed the 15 minutes I allow for each free solution in the Q&A Forum.

def newDay = GetDay() <> GetDay()[1];
rec highOfDay = if newDay then high else if high > highOfDay[1] then high else highOfDay[1];
rec lowOfDay = if newDay then low else if low > 0 and low < lowOfDay[1] then low else lowOfDay[1];
rec previousDayHigh = if newDay then highOfDay[1] else previousDayHigh[1];
rec previousDayLow = if newDay then lowOfDay[1] else previousDayLow[1];
plot targetHigh = previousDayHigh;
targetHigh.SetPaintingStrategy(PaintingStrategy.DASHES);
targetHigh.SetDefaultColor(Color.DARK_GREEN);
plot targetLow = previousDayLow;
targetLow.SetPaintingStrategy(PaintingStrategy.DASHES);
targetLow.SetDefaultColor(Color.DARK_RED);
plot crossAboveHigh = close[1] < previousDayHigh[1] and close > previousDayHigh;
crossAboveHigh.SetPaintingStrategy(PaintingStrategy.BOOLEAN_ARROW_UP);
crossAboveHigh.SetDefaultColor(Color.CYAN);
plot crossBelowHigh = close[1] > previousDayHigh[1] and close < previousDayHigh[1]; crossBelowHigh.SetPaintingStrategy(PaintingStrategy.BOOLEAN_ARROW_DOWN); crossBelowHigh.SetDefaultColor(Color.MAGENTA); plot crossBelowLow = close[1] > previousDayLow[1] and close < previousDayLow[1];
crossBelowLow.SetPaintingStrategy(PaintingStrategy.BOOLEAN_ARROW_DOWN);
crossBelowLow.SetDefaultColor(Color.MAGENTA);
plot crossAboveLow = close[1] < previousDayLow[1] and close > previousDayLow[1];
crossAboveLow.SetPaintingStrategy(PaintingStrategy.BOOLEAN_ARROW_UP);
crossAboveLow.SetDefaultColor(Color.CYAN);

Marked as spam
Posted by (Questions: 37, Answers: 4084)
Answered on May 31, 2021 12:44 pm
0
Thank you so much for the quick response and turnaround with the code, Pete! It would've helped if I provided the original code, but regardless, what you provided works great. There's one small issue however - after adding the code, my chart and candlesticks have gotten really small. I know this is a setting I should adjust, but cannot seem to figure it out. Is there anything I should adjust?
( at May 31, 2021 12:52 pm)
0
Navigate to: Chart Settings --> Price axis --> Fit studies and uncheck the box for "Fit studies".
( at May 31, 2021 4:42 pm)