This version has been replaced by new versions located on the following webpages:
Standard Divergence: https://www.hahn-tech.com/thinkorswim-standard-divergence-v4/
Hidden Divergence: https://www.hahn-tech.com/thinkorswim-hidden-divergence-v2/
Thanks to a huge response and feedback from our viewers we are very excited to publish version three of the Divergence Premium indicators for Thinkorswim. Along with the new version we have published a video titled “Thinkorswim Divergence Lines Upgrade”. We are also including a custom scan along with the upgraded version. Customers who already purchased version two are receiving the upgraded version at no extra charge! In this video we show how to adjust the settings and run the scan. And there is a live chart demo showing how the chart based alerts function. At the request of viewers, we have also added a companion study, available separately. The companion study measures divergence in a different way.
- Indicator Type: Momentum
- Indicator Basis: Price momentum diverging from price action
- Time Frames: All supported time frames and aggregation periods
- Trade Setups:
- Trend reversals
- Taking profits
- Scalping
We realize there are many techniques employed for reading divergence. We tried to be as accommodating as possible within the limits impose by the Thinkscript language. I’m sure you will be very excited to see the new ways these indicators can be customized to fit your needs.
Need more information?
To get pricing and see how to place your order click the link below.
Thinkorswim Premium Trading Tools
Please be sure to share this page with your friends and colleagues. Leaving comments below is the best way to help make the content of this site even better.
Watch the video, Thinkorswim Divergence Lines Indicator below:
Technical description of how the code works:
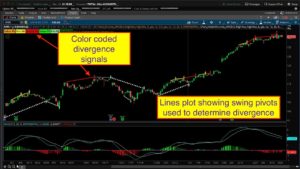
The code is designed to locate swing pivots in price. This is the first step. The swing pivots are defined using a default lookback period of 3. Increasing the lookback period causes the code to locate larger structures (macro as opposed to micro). The swing pivots are set by default to compare highs and lows. This can be adjusted to compare the close of each candle instead of the high/low. When plotted, each swing pivot is marked with a blue square.
For each swing pivot, the code compares the value of the lower study at the current swing pivot to the value of the lower study at the previous swing pivot. Lower swing pivot with a higher price momentum will generate a positive divergence signal. Higher swing pivot with a lower price momentum will generate a negative divergence. The default is to compare (on the price chart) low to low and high to high, in order to determine if swing pivots are higher or lower. This behavior can be adjusted so that the comparison is made from close to close.
Before requesting to purchase any of these indicators it is very important that you watch the demo video, otherwise you will not have the knowledge needed to adjust the indicator settings to get the behavior you seek.
DISCLAIMER: I AM NOT A CERTIFIED FINANCIAL ADVISOR AND NOTHING IN THIS VIDEO OR TEXT IS AN ADVERTISEMENT OR RECOMMENDATION TO BUY OR SELL ANY FINANCIAL INSTRUMENT. NOR IS THIS VIDEO OR TEXT INTENDED TO INSTRUCT YOU ON HOW TO MAKE BUY OR SELL DECISIONS USING ANY OF THESE INDICATORS.
*Thinkorswim is a chart analysis platform offered by TD Ameritrade: www.tdameritrade.com
TD Ameritrade provides financial services including the trading of Stocks, Futures, Options and Forex.
HI,
Wondering if you could help with the standDevChannel into a Watchlist?? I can’t get the “UnderPrice” to fire a warning. I think its my plot value if statement??? see below the code.
Thanks
def UpperLine =StandardDevChannel(“deviations” = 1.3).”LowerLine” is greater than close;
def LowerLine = StandardDevChannel(“deviations” = 1.3).”MiddleLine” is greater than close;
plot value = if UpperLine then 1.3 else if LowerLine then 1.3 else 0;
#def UpperLine = UpperLine1 > 1; #newCode
#def LowerLine = LowerLine1 < 1; #newCode
AddLabel(LowerLine, "UnderPriced", color.Black);
AddLabel(UpperLine, "OverPriced", color.black); #is working
AddLabel(!LowerLine and !UpperLine, " ", color.black);
AssignBackgroundColor(if LowerLine then color.RED else if UpperLine then color.GREEN else color.black);
Best place to find solutions is the Q&A Forum. Be sure to search first before posting a new question: https://www.hahn-tech.com/thinkorswim-forum-topics/
Your questions are appreciated but way to complex to be trying to work out these details in the comments section of the demo video. About the only one of your questions I can answer is #1, and the answer to that question was explained in the demo video. The settings for RSI and Stochastic are included in the upper chart study that plots divergence and all changes will need to be made there. Everything else you listed would be considered a modification, which you would need to submit as a custom project request after purchasing the full version. Details about how to submit a custom project request is located on the following webpage: https://www.hahn-tech.com/about/