Custom Scan Based on Ichimoku
Thinkorswim Scan Ichimoku
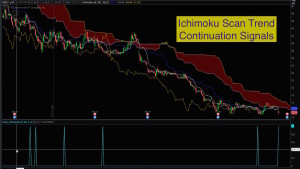
Free custom code linked below. Based on the Ichimoku study, this code will let you scan for Cloud Breakouts as well as Trend Continuation signals. The signals are crafted to mirror the techniques taught by Hubert Senters (videos linked below). It will scan for longs or shorts. Each scan signal has two versions. One captures the raw signal and the second adds a filter using the Chikou (Lagging Line) to confirm the bullish or bearish direction. This provides a total of 8 different signals you can use for scans.
Here is a link to the custom code for running the scans in Thinkorswim:
Here is the link to video instruction by Hubert Senters:
Ichimoku Trading Strategies For Finding Better Trades by Hubert Senters
Lean More:
Would you like to learn how to master the custom scan tools on Thinkorswim?
Click here: Thinkorswim Scans Beginner to Advanced
Learn how to build custom scans without writing any code: Thinkorswim Condition Wizard
DISCLAIMER: I AM NOT A CERTIFIED FINANCIAL ADVISOR AND NOTHING IN THIS VIDEO OR TEXT IS AN ADVERTISEMENT OR RECOMMENDATION TO BUY OR SELL ANY FINANCIAL INSTRUMENT. NOR IS THIS VIDEO OR TEXT INTENDED TO INSTRUCT YOU ON HOW TO MAKE BUY OR SELL DECISIONS USING ANY OF THESE INDICATORS.
*Thinkorswim is a chart analysis platform offered by TD Ameritrade: www.tdameritrade.com
TD Ameritrade provides financial services including the trading of Stocks, Futures, Options and Forex.
Please be sure to share this page with your friends and colleagues. Leaving comments below is the best way to help make the content of this site even better.
Is is possible to set up the scan so that it only returns stocks that have the requirement (e.g., BreakAboveCloud and BullishConfirmation) for a certain time period? The problem that I am running into is that on my daily chart, it returns stocks that have this bullish indicator that are from later in the previous trading day.
I’m not sure I understand the question or the issue you are describing. If the chart and the scan are setup with the same exact settings, the scan is only able to return stocks that meet the criteria on the most current (active) bar on the chart. If you set everything to the daily time frame, the scan is only able to produce a list of stocks in which the signal is present on today’s candle. If you are getting results that do not match that description then you need to double check all of your settings.
I click on the link to install the scanner into my ToS but it sends me to download it via google drive then as a movie file. How do i fix that so I can upload it to my ToS scanner? I copy and pasted the link to the “Open shared item” on ToS and it says the link is broke.
This question has already been asked and answered in an earlier comment below dated November 2018. The following link will explain what you are missing: https://www.hahn-tech.com/ans/how-to-download-and-import-study-ts-files-into-thinkorswim/
I’m a huge fan of your work. Thanks for all you do. Question. For your Scan_IchimokuSTUDY.ts is there a way to modify the scan so the results show if the signal was true “within X bars”. Sorry for such a basic question but my scripting skills are very limited although I am slowly learning by going through your videos. Thank you in advance for your help.
That would require a modification to the code. This sort of thing cannot be done by adjusting any settings.
Thank you Pete. If it is an easy modification and you can share that would be great. If you cannot for any reason I understand and I appreciate all you do. I’ve learned a lot from your videos.
Each scan signal requires the same modification. Taking the very first scan signal from the list. The modification looks like this: plot scan = signalBreakAboveCloud within 10 bars;
Thank you. Much appreciated.
This video is specifically for the Ichimoku scan. Not the chart study. It is possible to plot any code created for a scan as a lower study. But if you are looking for an Ichimoku chart study then you should be looking in the “TOS Charting” category.
Please stop posting code in the comments section of the video. This is not the place where we can provide assistance of this complexity. That’s what the Q&A Forum is for. I just used the link in the description this video to download the code used to run the scan. The code for the scan contains 73 lines. I don’t have the foggiest idea where you are getting this code from but it is not coming from the file I provided with this video.
Sorry, sometimes the best response I can give is blunt and rather harsh. Trust me that is not an easy thing for me to do. But over the years I have become better at knowing when to “punch that button” and help our viewers to get themselves out of the weeds.
Hello Pete,
Thank you for your great contribution to the community!
I noticed that Ichimoku setup in ToS (Chikou span line) is offset by 1 bar (27 instead of 26) – even in the standard Indicator in ToS, compared to TradingView and TradeStation. Is that a problem? What do you think the reason is?
Best,
F
That is a very good observation and I took some time to examine this from various sources. StockCharts.com is what I consider an authoritative source on chart indicators. The charts they display for Ichimoku match the way Thinkorswim computes it. TradingView indeed computes it differently as does TradStation. However TradeStation provides an additional user input named “CountCurrentBarInOffset”. Set that input to zero and it matches Thinkorswim. So it appears to be a matter of preference, with TradeStation providing the most flexibility to adjust it according to user preference. This would have made for a very excellent post in our Q&A Forum. Very few folks will see this question and solution here in the comments section of the video.
Hi Pete, thank you for all that you do. Could use your help as I can’t get a simplified scan to work.
I need a scan, no plot, that will search a watchlist for when the Chikou crosses the cloud in any timeframe with a variable lookback period. Price is not a concern. Just want the stock to show in the scan when the chikou crosses within a certain amount of bars.
1 – Show up on scan when:
– the chikou crosses up over Span A when green cloud, or Span B when red cloud on any timeframe
– the chikou cross occurred within the last x bars (variable input)
2 – opposite of 1 for when it crosses down under the cloud
Tried to do this with Conditions tool but the scans just won’t produce results. Also tried modifying your scan above with no success.
Thank you!
It is not possible to provide such complex solutions in the comments section of a video. Be sure to search our Q&A forum first, as there are many posts on the Ichimoku in our forum. If you don’t find a solution already posted there then submit a new question in the forum.
Hi Peter, can you confirm when the code says Chikou > Span A, does this account for Span A being -52 periods for Chikou to cross or does it consider Span A at current period?
As I recall, the Chikou is the current bar’s close displaced 26 bars to the left. Not 52 as you have stated. So being that the last value of Chikou printed on the chart is actually the current bar’s close. This would mean the current bar’s close is greater than Span A.
In the code, defined Kijun_period is 26 periods. But I couldn’t figure out if this will be Span A’s current value (which is at +26 periods in future) or value at Chikou (-52 periods from current Span A). Thanks again.
Sorry for the bother, but I am still learning the coding and trading.
I may be interpreting the Cloud breakout wrong. But it seems like Chikou is -26 (Keijun Period) cross (value of -52 periods of Span A or B).
I can see that Chikou being current price offset in 26 periods. However, I am not clear if the Span A value is also shifted back to 2x keijun periods.
Its highly likely that I am totally wrong. For that I apologize and sorry for the trouble.
Well it has been 5 years since I published this and I built everything based on the teachings of Huber Senters. So I defer to him for the full explaination. However if you like to tinker with stuff like this you just need to create a custom chart study to plot this on a lower subgraph:
declare lower;
input tenkan_period = 9;
input kijun_period = 26;
input lookBack = 5;
input breakOutBars = 3;
def Tenkan = (Highest(high, tenkan_period) + Lowest(low, tenkan_period)) / 2;
def Kijun = (Highest(high, kijun_period) + Lowest(low, kijun_period)) / 2;
def “Span A” = (Tenkan[kijun_period] + Kijun[kijun_period]) / 2;
def “Span B” = (Highest(high[kijun_period], 2 * kijun_period) + Lowest(low[kijun_period], 2 * kijun_period)) / 2;
def Chikou = close[-kijun_period];
plot test = Chikou > “Span A”;
I use this technique throughout my entire library of tutorial videos as well as the development work I do every day of the week.
It’s very difficult to explain this without a screenshot. So please refer to the video linked in the description of the video that shows how Hubert Senters created this setup. That will explain things much more clearly than I can.
thank you this is what I been looking for