| ♥ 0 |
To provide a little bit on context, I am currently using a custom scan (on the scan tab of TOS) for identifying stocks in a squeeze. I have found the following code online, which seems to work very well for me: reference BollingerBands().”Upperband” is less than KeltnerChannels().”Upper_band” or reference BollingerBands().”lowerband” is greater than KeltnerChannels().”lower_band” What I usually get when using that is a list of stocks that are currently in the squeeze. What I am looking for is a code to supplement that so I can add it as an additional scan query (to a new custom scan). In particular I would like to use a code that will identify stocks whose TTM_Wave C (long-term wave) is in cyan color, indicating an expansion (either positive or negative it doesn’t matter so long as WAVE C is expanding). What I plan on doing is using the code I already have, which scans for squeezes in conjunction with this new code to reveal stocks which are both in the squeeze and whose Wave C is currently in cyan color. Thanks in advance!
Marked as spam
Asked on January 8, 2017 10:20 am
1762 views
|
|
Private answer
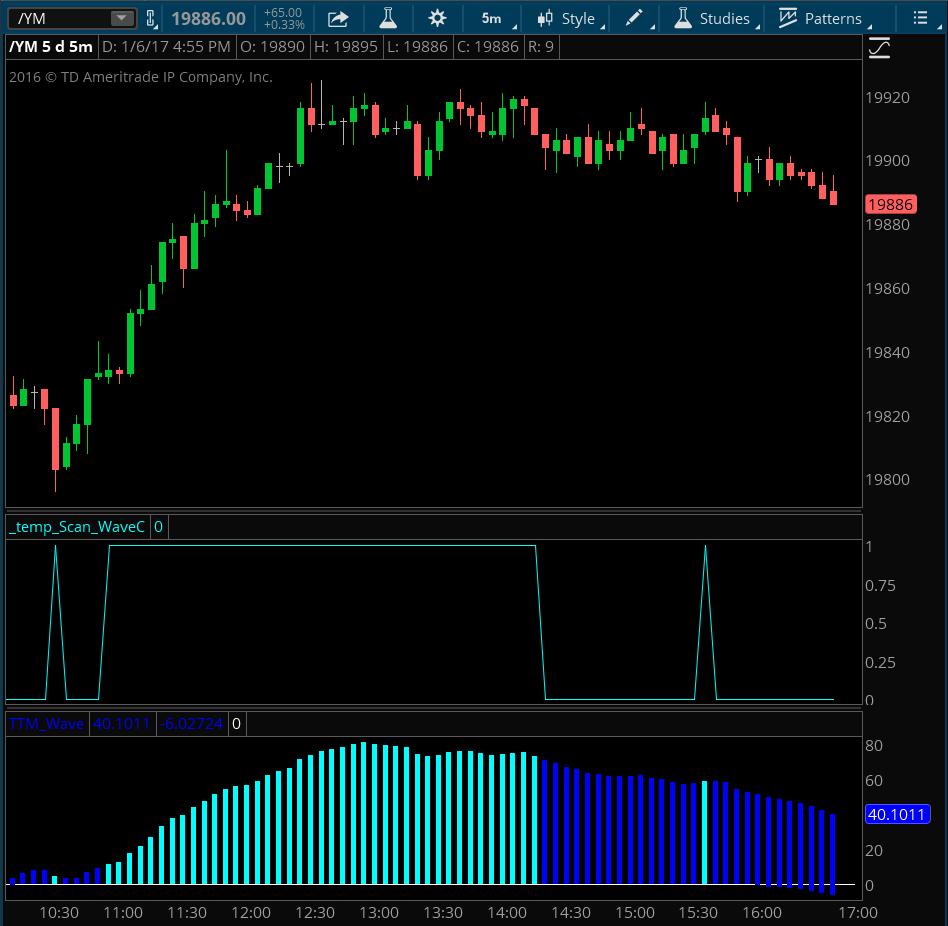
First things first. That code you are using for squeeze is not an exact match to the way it’s done by the version from TTM. It’s close, but not exact. it is a pretty simple matter to reference the actually TTM_Squeeze from within a custom study or scan. In fact, my solution to your Wave C question uses this very technique. If you would like to see an example of how to do this using the built in TTM_Squeeze you can view it here: https://www.hahn-tech.com/ans/ttm-squeeze-scan-that-looks-the-number-of-red-dots-in-a-row/ I have attached a screenshot showing how this scan code changes from zero to 1 when Wave C changes from blue to cyan. The code can be used in a chart study or a custom scan criteria. Here is the code:
Attachments:
Marked as spam
Answered on January 8, 2017 12:31 pm
|
|
|
Private answer
Thank you very much Pete! I used the code and it works exactly as I wanted. I was wondering if there is a way to create a scan with the additional condition that the value of Wave C is +/-2 or more. How can I adjust the code to focus on stocks whose Wave C is above or below the value of 2 (or any other value for that matter)? Marked as spam
Answered on January 8, 2017 3:36 pm
|
|
|
Private answer
First, it’s important to understand the C Wave is actually made up of two separate lines. It’s plotted like a histogram but there are two components. In the code, these lines are: So when you say you want a condition for when the C Wave is plus or minus some value. It’s important to realize that with two lines, it can be both plus and minus at the same time. In fact for most of the time these two lines are straddling the zero line. But to express what you describe in the code. It’s pretty simple:
or
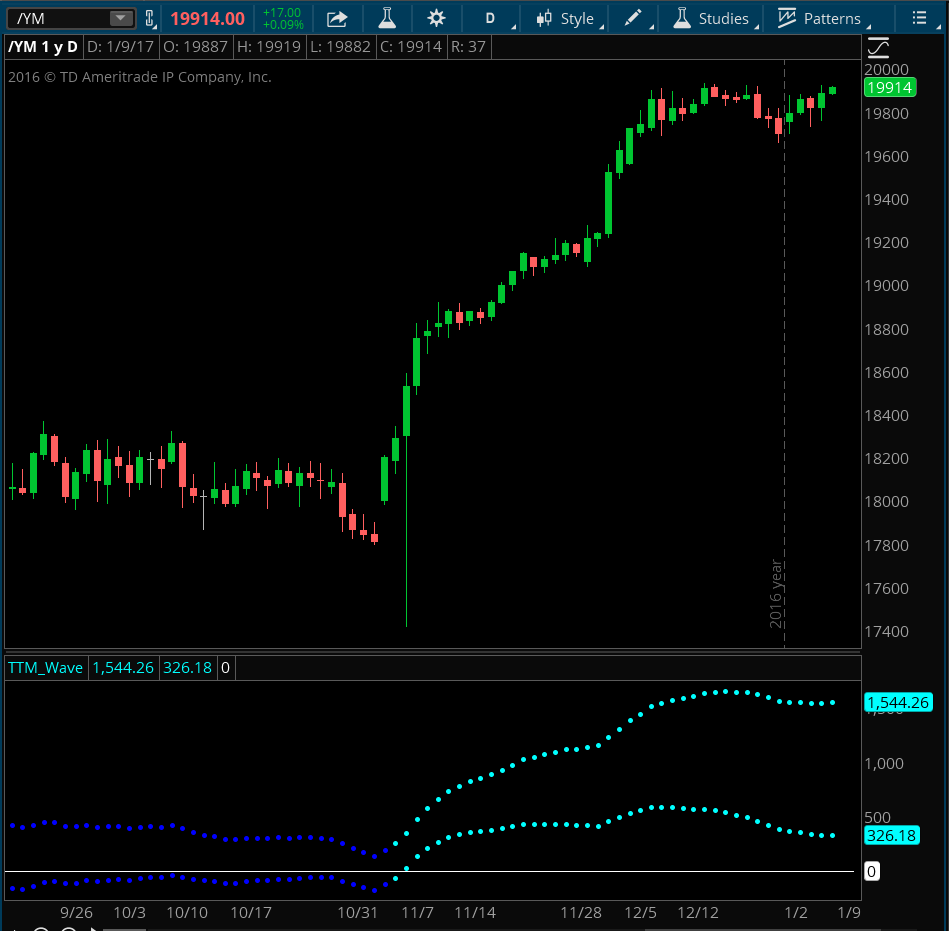
But as I mentioned, both of these conditions will be true most of the time. So you will need to consider these two lines and decide how you want to address this. You can get a clearer picture of this if you change the indicator to plot the lines individually instead of as a histogram. See attached screenshot for a demonstration. This is a daily chart of /YM. Go ahead and compare this to the way it normally prints and you will see the histogram hides the true nature of this indicator.
Attachments:
Marked as spam
Answered on January 8, 2017 7:22 pm
|