Horizontal line from earnings high to end chart


Category:
0
0

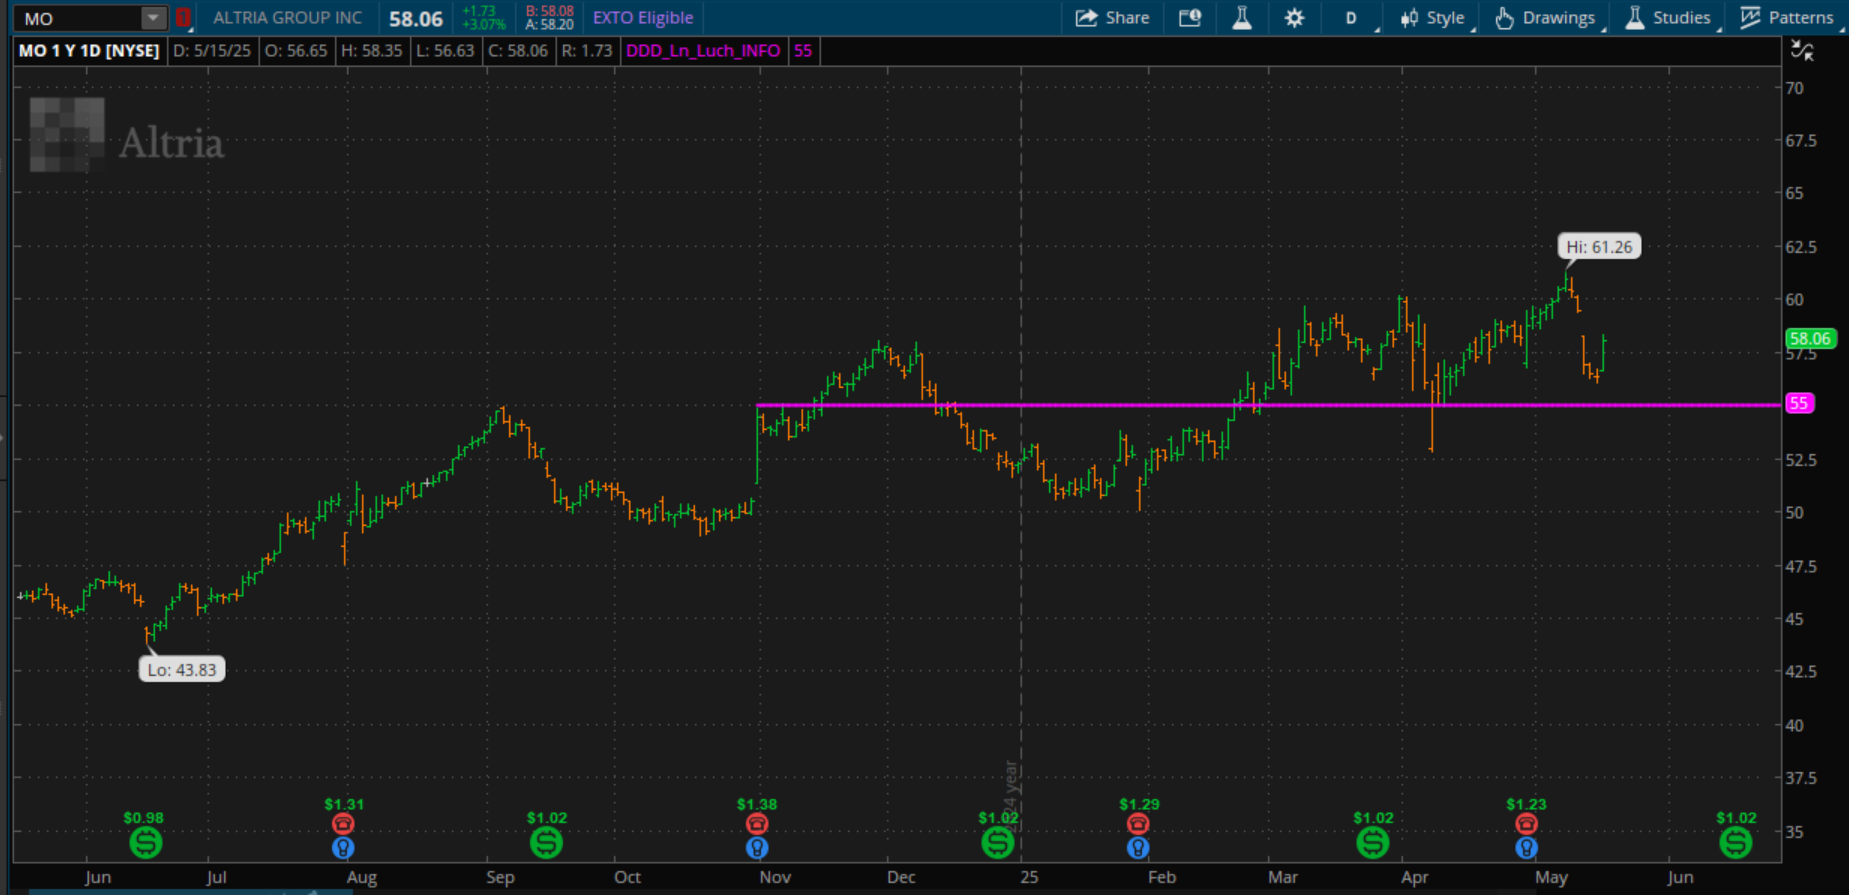
Hello, dear Pete Hahn.

Thank you for your support in this direction.

Plot a horizontal line from high to end chart (to right),
from the 3rd penultimate Earning.

perfect example :))) :

(currently, Altria asset “MO”. TF.: “D 1Y:1D”)

def bn = BarNumber();
plot customLine = if bn >= 117 then 55 else Double.NaN;
customLine.SetDefaultColor(Color.MAGENTA);
customLine.SetLineWeight(2);
customLine.SetStyle(Curve.FIRM);

# end

You can help with this,
How to do this programmatically?


Attachments:
Marked as spam
Posted by (Questions: 2, Answers: 0)
Asked on May 16, 2025 1:43 pm
4 views
0
Private answer

I know you are expecting an elegant solution to what appears to be a simple request. However in Thinkorswim, we don't have that luxury for something like this. We have a choice between two options. One of which I refer to as brute force methods, which I have employed in my solution below. And the other choice we have are elegant solutions which in this case, are so ridiculously convoluted they will destroy your sanity.

What Thinkorswim is lacking is a looping structure which enables us to handle multiple variables and custom arrays. Those tools and data objects simply don't exist. So while something like this is very easy and simple to do on most other trading platforms, they a royal nightmare to try to implement in Thinkorswim.

And when it comes to free solutions I am willing to post in the Q&A Forum, I am cannot afford the time to go through that nightmare just for the "fun" of it.

So here is the free solution I am willing to give away. this plots four separate lines on the chart. One for each of the four most recent earnings highs.

def targetBar = HasEarnings();
rec highOfEarnings = if HasEarnings() then high else highOfEarnings[1];
rec firstEarningsHigh = if highOfEarnings[1] == 0 and highOfEarnings > 0 then high else firstEarningsHigh[1];
rec secondEarningsHigh = if highOfEarnings <> highOfEarnings[1] and firstEarningsHigh[1] == highOfEarnings[1] and highOfEarnings[1] > 0 then highOfEarnings else secondEarningsHigh[1];
rec thirdEarningsHigh = if highOfEarnings <> highOfEarnings[1] and secondEarningsHigh[1] == highOfEarnings[1] and firstEarningsHigh[1] > 0 then highOfEarnings else thirdEarningsHigh[1];
rec fourthEarningsHigh = if highOfEarnings <> highOfEarnings[1] and thirdEarningsHigh[1] == highOfEarnings[1] and secondEarningsHigh[1] > 0 then highOfEarnings else fourthEarningsHigh[1];
plot earningsHighOne = if firstEarningsHigh > 0 then firstEarningsHigh else Double.NaN;
plot earningsHighTwo = if secondEarningsHigh > 0 then secondEarningsHigh else Double.NaN;
plot earningsHighThree = if thirdEarningsHigh > 0 then thirdEarningsHigh else Double.NaN;
plot earningsHighFour = if fourthEarningsHigh > 0 then fourthEarningsHigh else Double.NaN;

Marked as spam
Posted by (Questions: 37, Answers: 4135)
Answered on May 16, 2025 1:51 pm