| ♥ 0 |
Hi Pete, I’ve been wanting to tinker with this one for awhile. Today I have successfully created scans that are synchronized with the studies on my charts. I am wondering if you have created watchlist columns along the way? It would be great to have a “rsi crossover” colored box and a “stronger than” colored box next to the symbols in my watchlist. Let me know please and if you have not created them but could build them for me that would be great! Doug
Marked as spam
|
|
Private answer
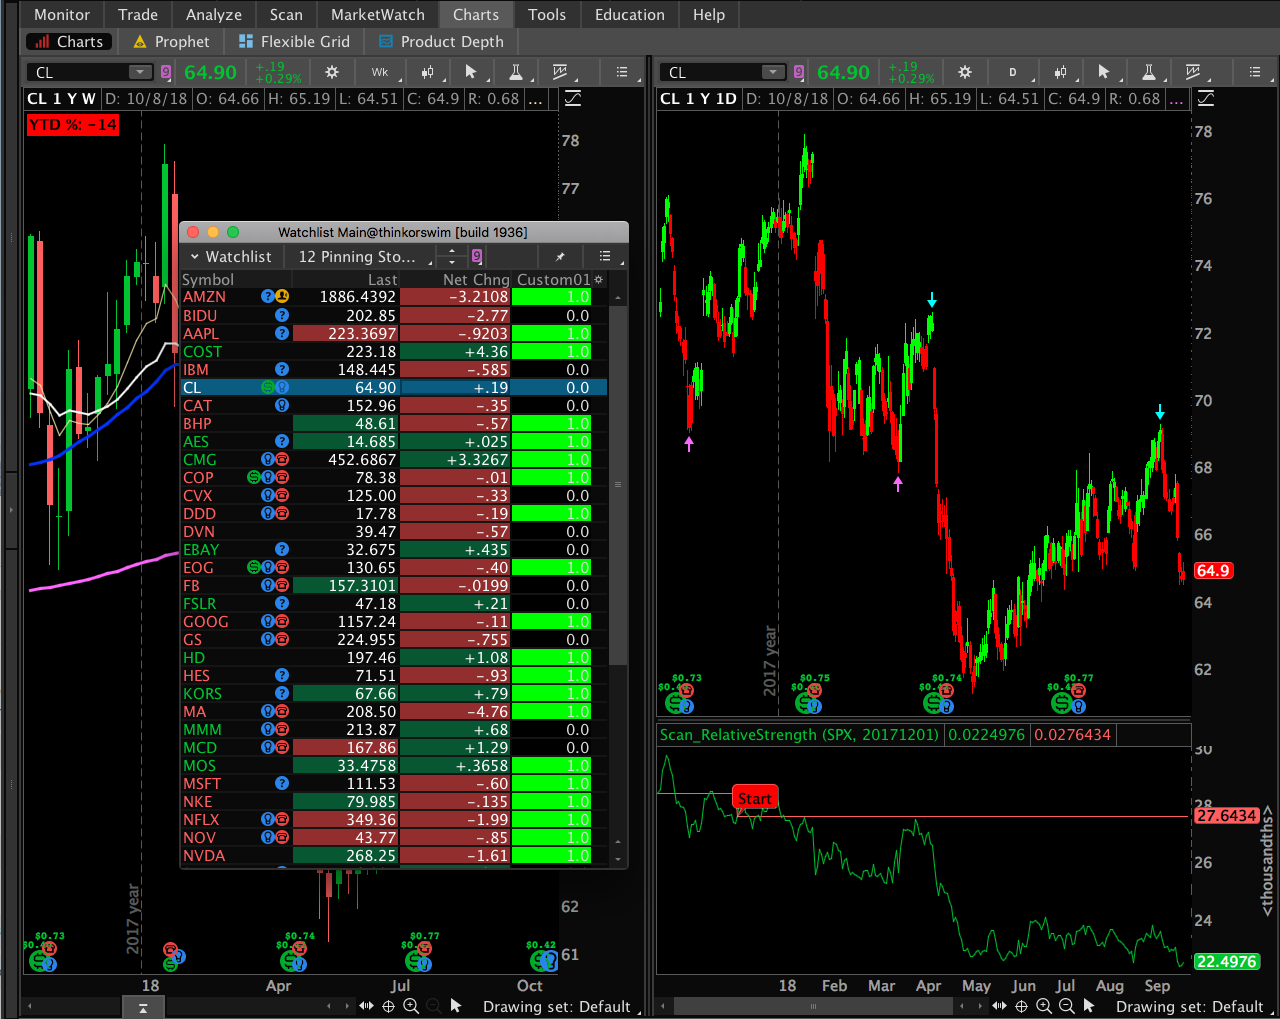
Ok, when markets are open, this works. When markets are closed, it does not. You have been warned. This is the code to show red or green background on the watchlist based on the relative strength of the ticker symbol in that row, as compared to the ticker symbol you select for “CorrelationWithSecurity”. The default value being “SPX”. Please note the user input “referenceDate” must be set to a day in which markets were open. The custom column must be set to daily. If you want details on the source of this code you will want to view the following video: https://www.hahn-tech.com/thinkorswim-scan-relative-strength/
Screenshot below shows the result. I did not provide code for the “RSI Crossover” because that portion of the request lacked specific details. I suggest you post that as a new question and consider the following. How are the colors determined? RSI Crossing over what? Should the color change for only on the bar a crossover occurs or should the color remain the same color until the next opposite crossover? Keep in mind that “RSI”… http://toslc.thinkorswim.com/center/reference/Tech-Indicators/studies-library/R-S/RSI.html …is not the same as “Relative Strength” http://toslc.thinkorswim.com/center/reference/Tech-Indicators/studies-library/R-S/RelativeStrength.html
Attachments:
Marked as spam
Answered on October 8, 2018 8:06 am
|
Just a quick heads-up. I drew up the code for this but it does not work while equity markets are close. I will have to waiting until tomorrow morning and test it during market hours.