| ♥ 0 |
Hello, I need help creating a simple line that draws a horizontal line 100% above the premarket low.
So if the stock premarket low is $2, the line will appear at $4 dollars.
-This line should extend to the right up to 9:30am market open and end -This line should you the premarket low of the current day only even if I have a multiday chart up
*Bonus if this works on Mobile as well
Thank you
Marked as spam
|
|
Private answer
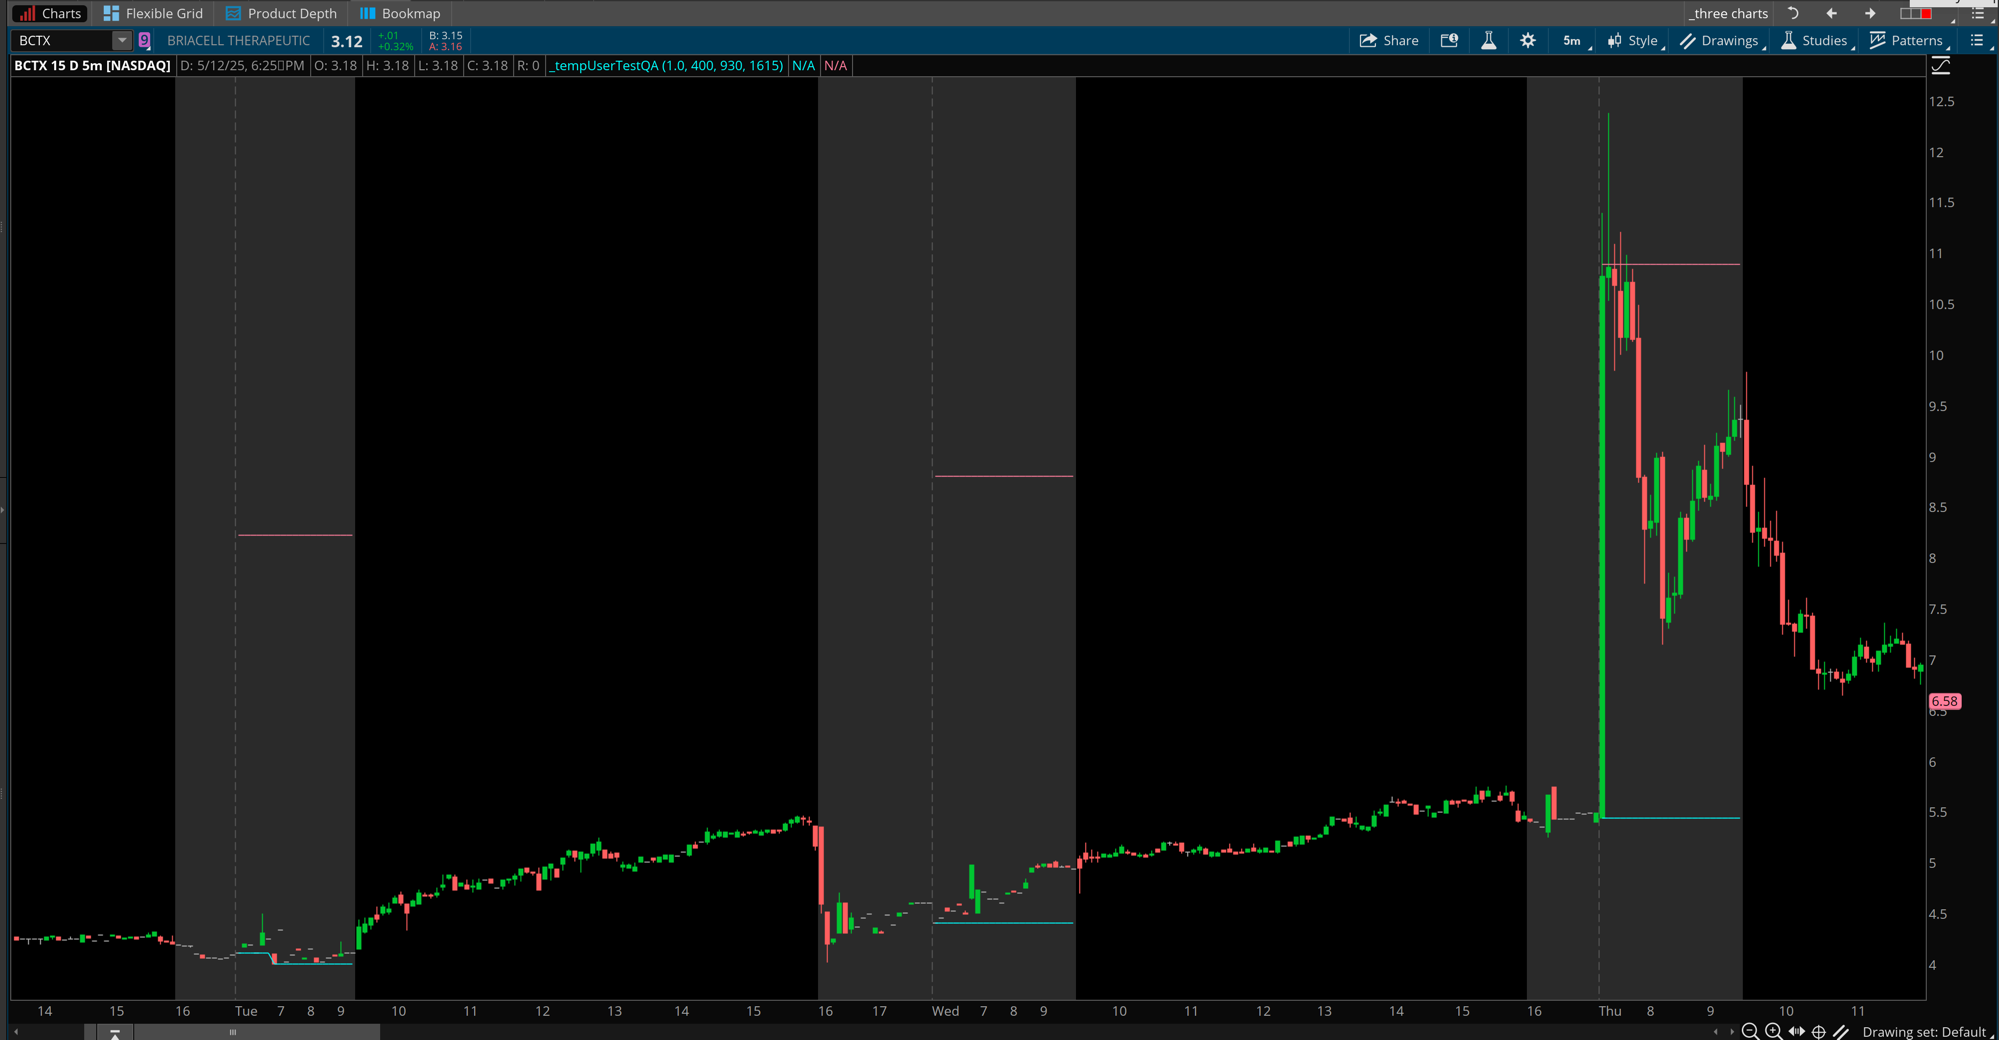
Next time it will be most helpful if your provide an example screenshot showing where these lines would show up on a chart in which the target price is actually touched in the premarket session. It took me longer to find an example stock to include with my solution than it took to create the solution itself. I see you asked that this only plot on the current trading session and not on previous sessions. That sort of complexity is not something I can provide free of charge in this Q&A Forum. So the solution I created will plot the lines on all trading sessions in which there was sufficient premarket trading data to compute the levels. Also note I have included some additional user inputs. The times are set to Eastern Time Zone. There is an input that allows you to adjust the multiplier, so that other viewers that come across this solution are able to adjust it to fit their own preferences. And one final detail I included is an input for the premarket session start time. On Thinkorswim, the chart displays what is referred to as "Extended Session Hours". There is no way to display the premarket session and exclude the after market session. So the user input is provided with a default value set to 4 am, which is the traditional start of the premarket session on most exchanges. Here is the solution:
And the screenshot below shows how this plots on a chart. Attachments:
Marked as spam
Answered on May 12, 2025 4:05 pm
|