ichimoku cloud column


Category:
1
0

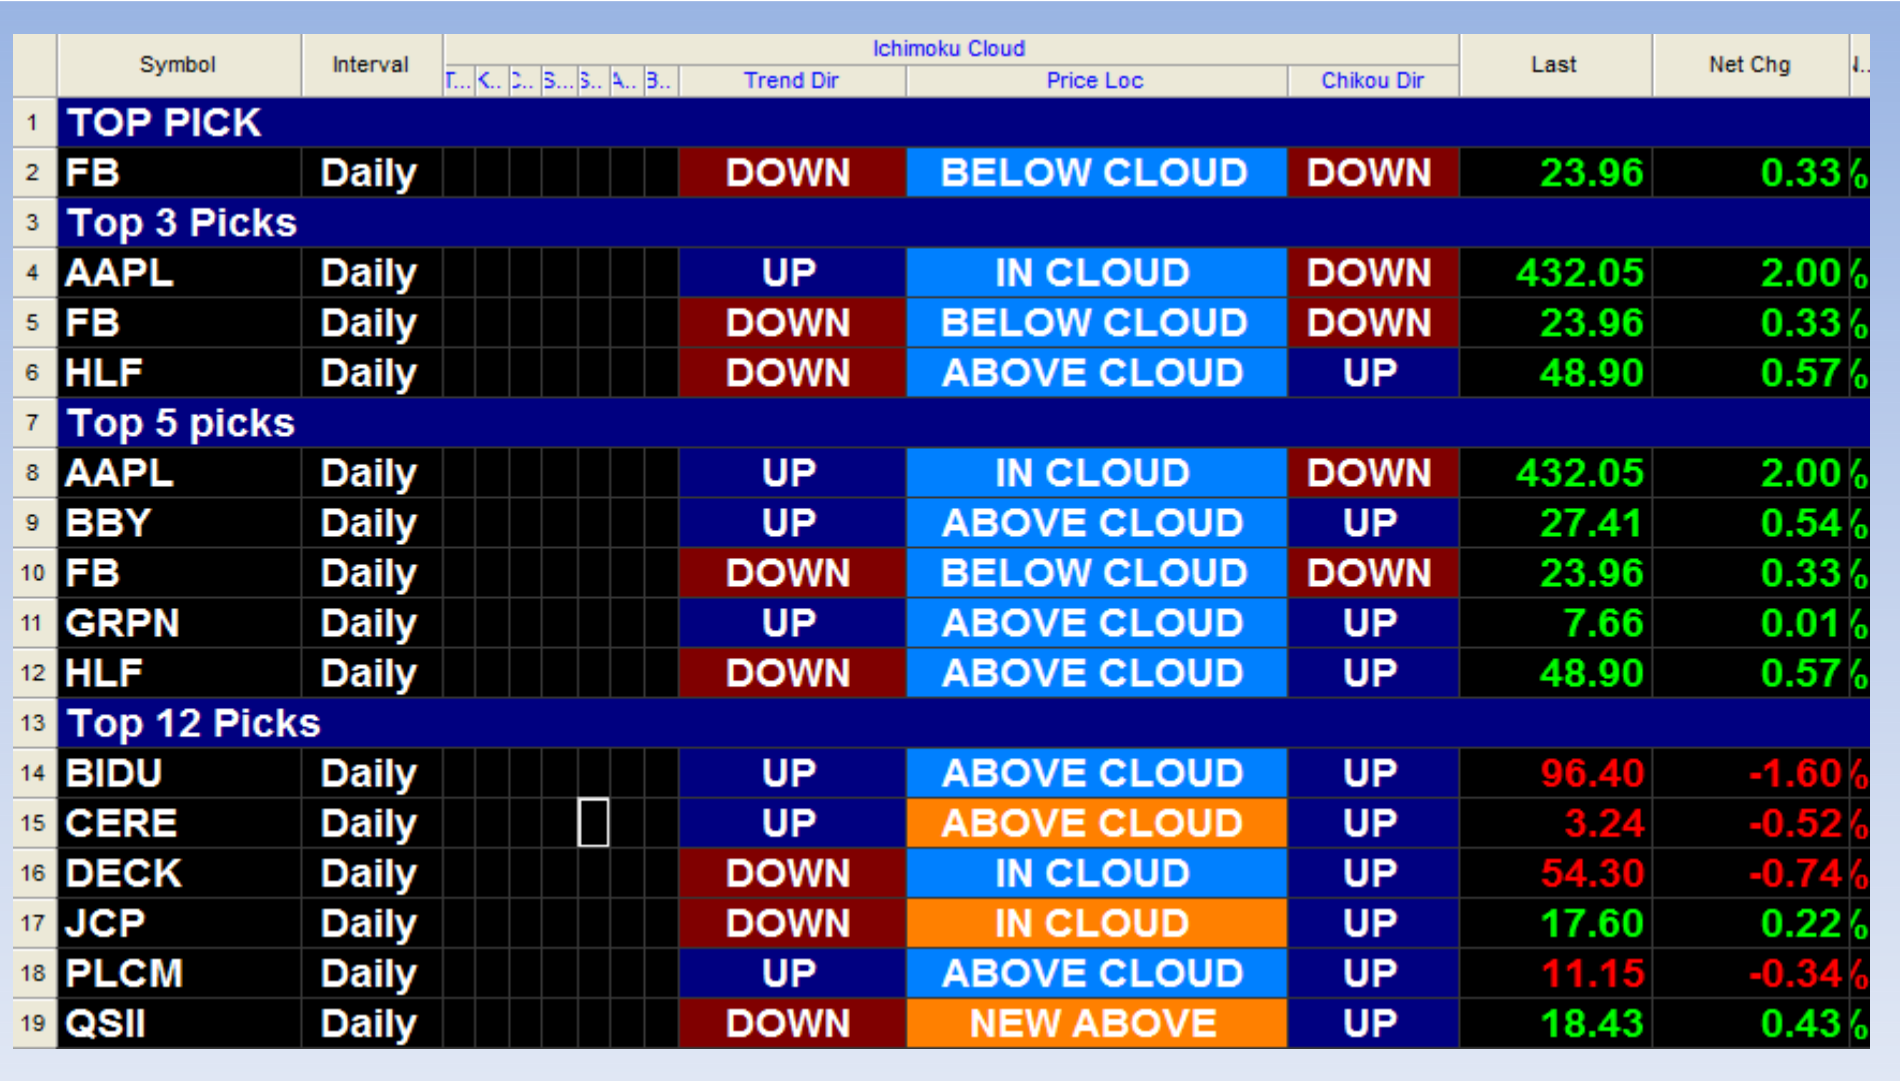
Hi there, sorry to bother you… but I was wondering if you could help me create a custom column in my watch lists…

i would like for it to indicate if the stock is above, below or in the ichimoku cloud (and if possible what direction it’s entering the cloud from… i.e. using blue for above and orange for below…

Thanks so much for all of your help 🙂

Attachments:
Marked as spam
Posted by (Questions: 2, Answers: 6)
Asked on March 14, 2017 5:23 pm
365 views
0
What app is the screenshot Nathan
( at November 7, 2019 9:08 am)
0
How do I use this script Hahn
( at November 7, 2019 9:08 am)
0
The code I provided is applied to a custom watchlist column in Thinkorswim. If you have not worked with this tool before I have an entire library of fee tutorials on this topic. To get started, I suggest you view the two videos listed under "For Watchlists:" in the following post on our Q&A forum: https://www.hahn-tech.com/ans/where-to-start/
( at November 7, 2019 1:44 pm)
1
Private answer

Thanks for providing that screenshot, it really helps explain what you are looking for. We can easily do the color scheme based on position of close above, below or inside the cloud. The other items such as trend direction and chikou direction would require some clearer specifications. I have no idea how those items are defined. Even your request to indicate from which direction the price is entering the cloud. Price enters the cloud on one bar. Once that bar has passed, prices can remain in the cloud for an extended period of time. Does it still matter which direction it entered from after it’s been in the cloud for 20 bars?

So I’ve taken care of the elements that are clearly specified. The other items will remain uncompleted until a clearer specification can be provided. It’s up to our viewers to provide those specifications. Don’t forget to up-vote any questions that best solve your question!

#------ Inputs for Ichimoku plots
input tenkan_period = 9;
input kijun_period = 26;
#----------- Section for plotting the Ichimoku
def Tenkan = (Highest(high, tenkan_period) + Lowest(low, tenkan_period)) / 2;
def Kijun = (Highest(high, kijun_period) + Lowest(low, kijun_period)) / 2;
def "Span A" = (Tenkan[kijun_period] + Kijun[kijun_period]) / 2;
def "Span B" = (Highest(high[kijun_period], 2 * kijun_period) + Lowest(low[kijun_period], 2 * kijun_period)) / 2;
def closeAboveCloud = close > "Span A" and close > "Span B";
def closeBelowCloud = close < "Span B" and close < "Span B";
def closeInsideCloud = (close > "Span A" and close < "Span B") or (close < "Span A" and close > "Span B");
plot data = if closeAboveCloud then 1 else if closeBelowCloud then -1 else if closeInsideCloud then 0 else 0;
AssignBackgroundColor(if data > 0 then Color.BLUE else if data < 0 then Color.ORANGE else Color.BLACK);

Marked as spam
Posted by (Questions: 37, Answers: 4087)
Answered on March 14, 2017 6:10 pm
0

OK, I see what you mean with regard to once it’s in the cloud…makes total sense! how about the ”trend” direction using lin. reg. in lets say the daily chart? as an example, i use lin reg 100, 50 and trendline in my charts… do you suppose there’s a way to tie that into the direction of overall stock… then perhaps it wouldn’t matter if it was above, below or in… but would indicate overall direction?

( at March 14, 2017 7:36 pm)
0

just thinking out loud! thanks so much for putting this all together!

( at March 14, 2017 7:40 pm)
0

honestly, I guess trend is not too necessary as you can quickly tell by looking at the charts…

( at March 14, 2017 8:23 pm)