History of price spiking (aka former stock runner) chart label


Category:
0
0

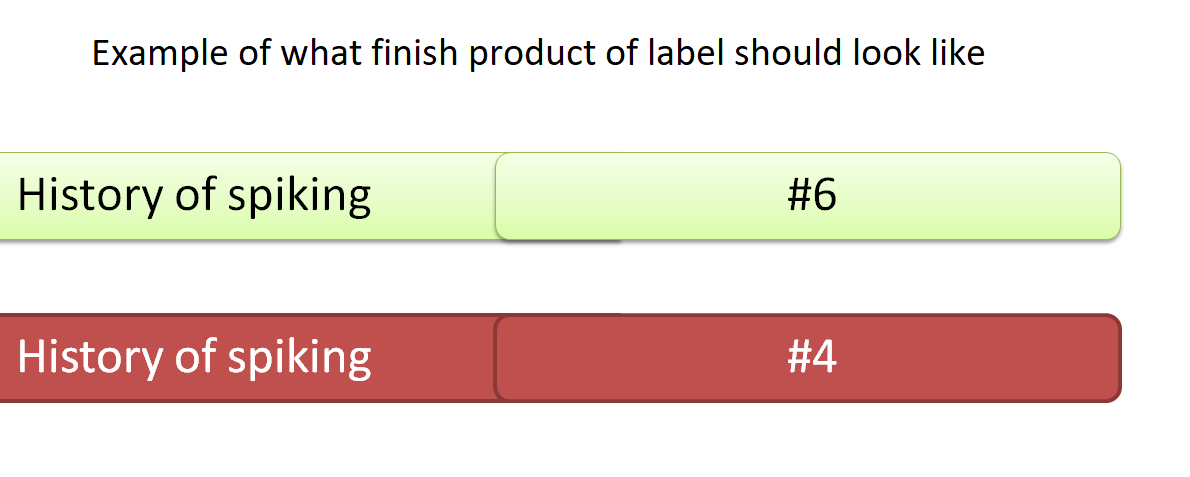
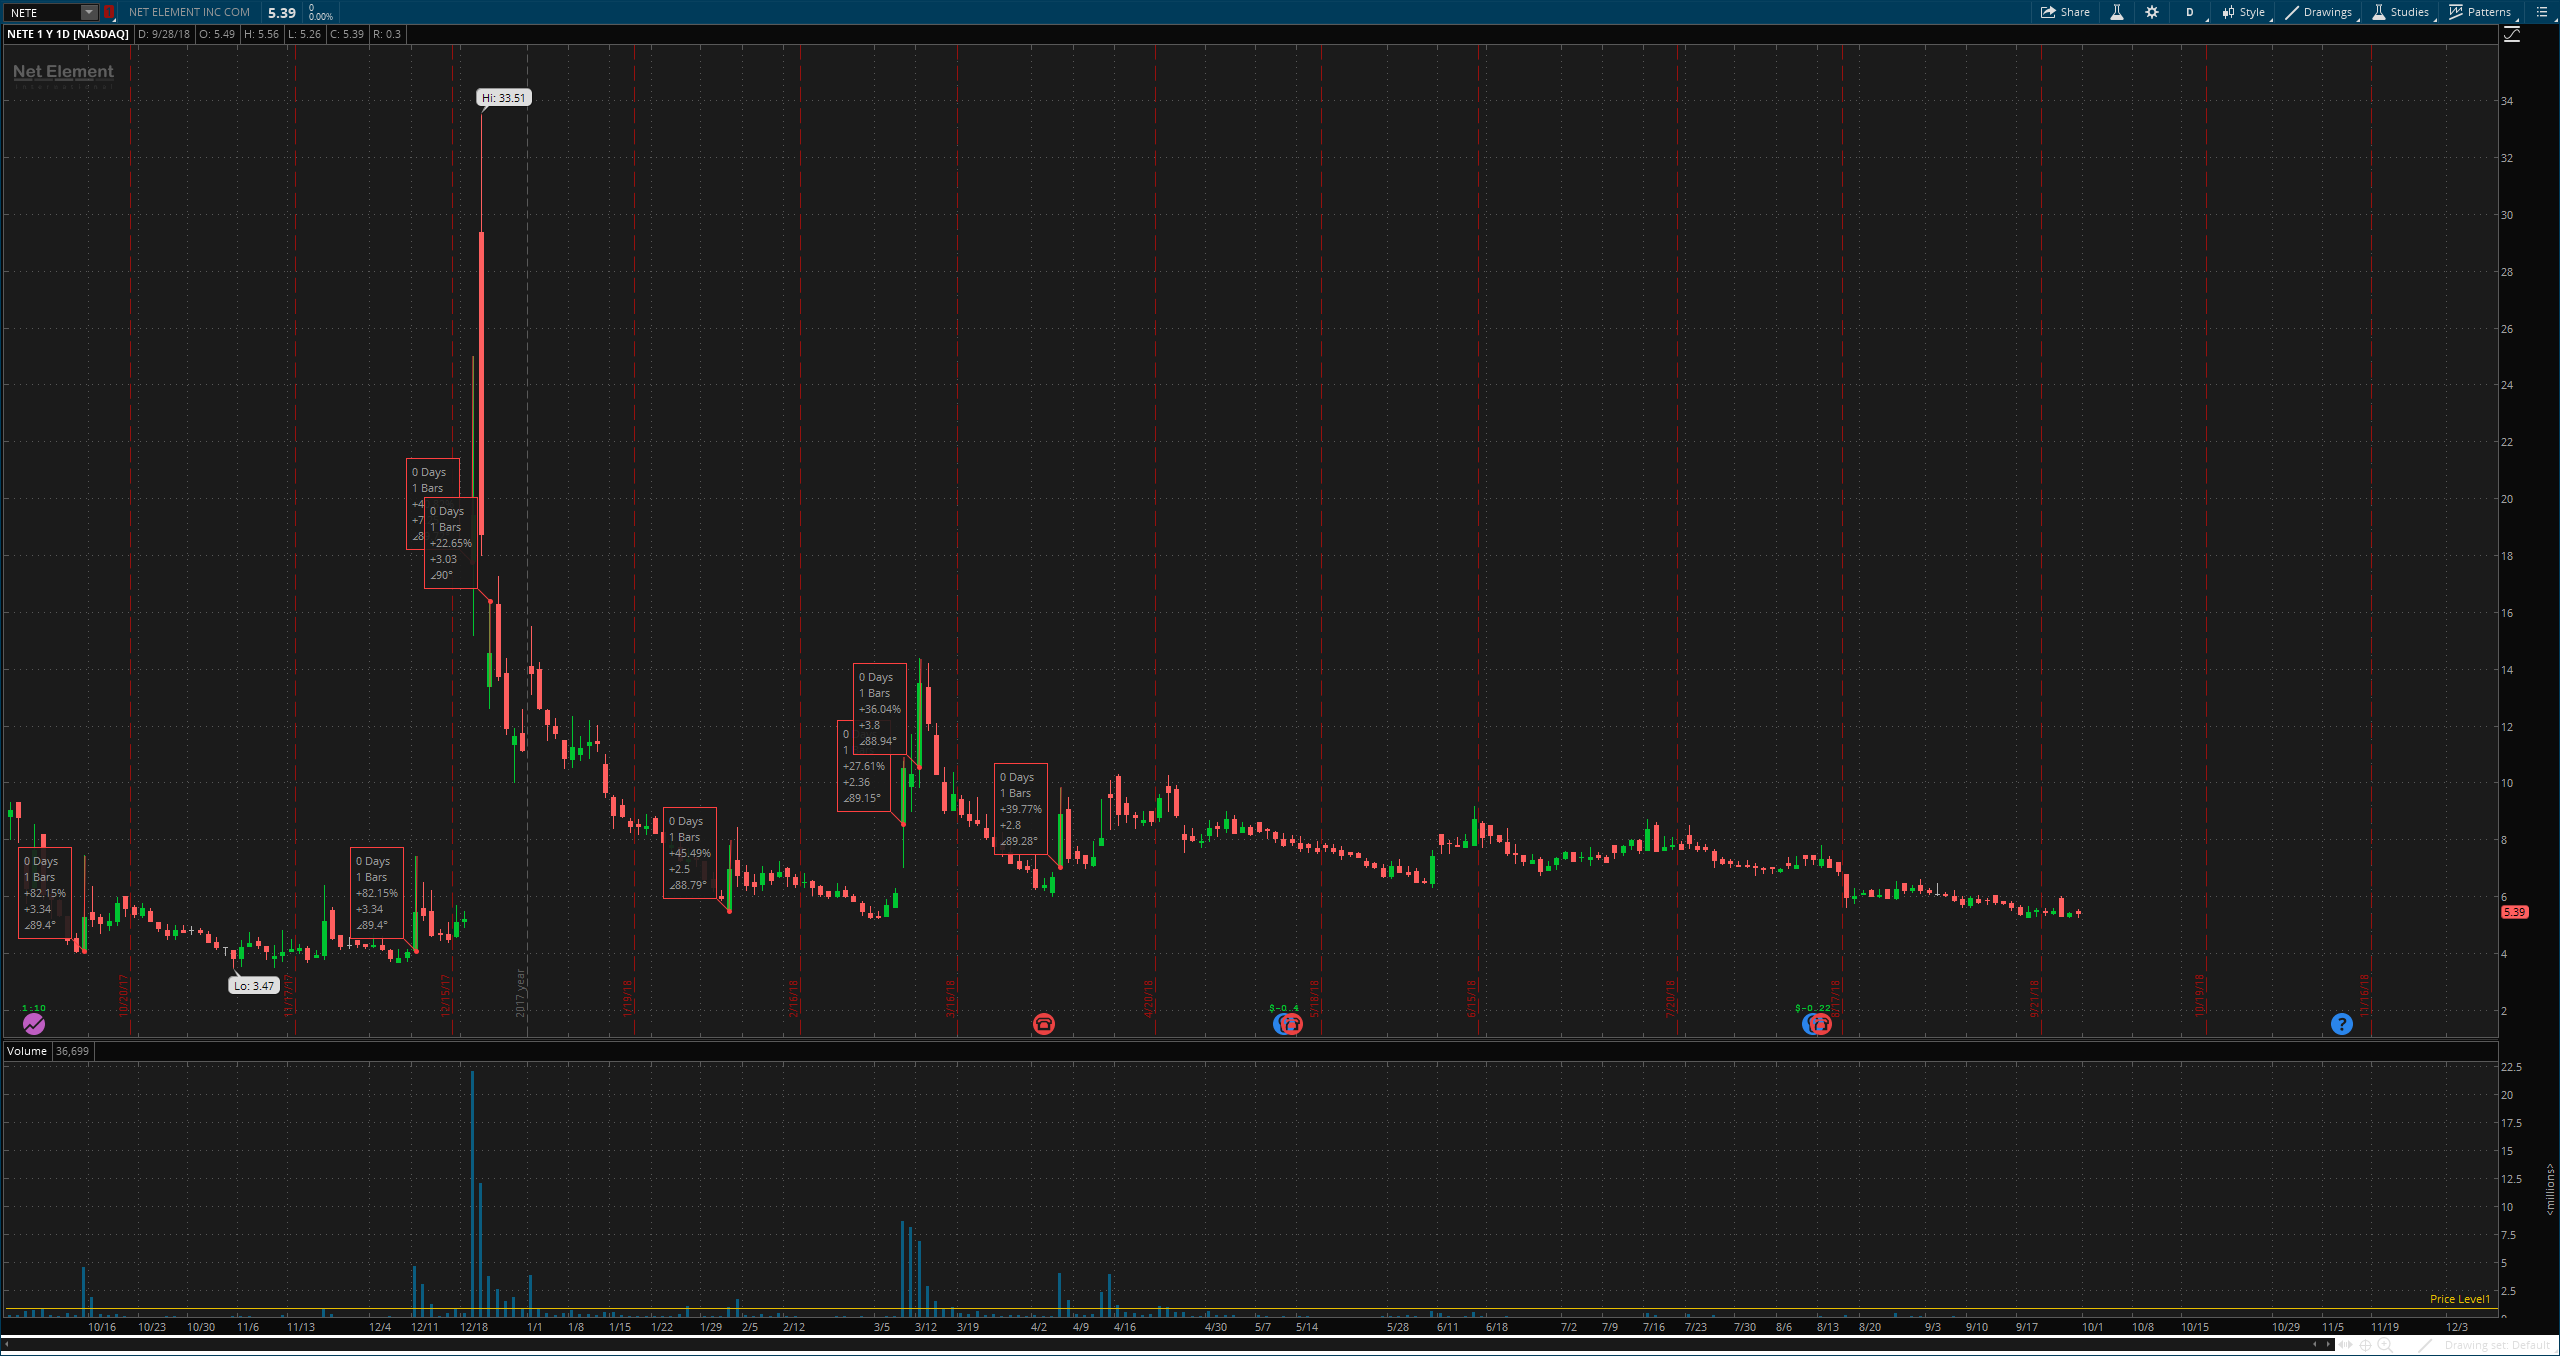
Hello Hahn, when looking to trade a stock a lot of traders look at a stocks previous history for the potential of the stock running up and making large moves to the upside.
The question is how we can create a chart label that displays this historical information?

Condition: How many times in the past year (1year 1day chart) has the stock spiked up 30% or more.

defSpike condition
Open open by at least 30%

Attachments:
Marked as spam
Posted by (Questions: 22, Answers: 63)
Asked on October 1, 2018 4:58 am
108 views
0
Private answer

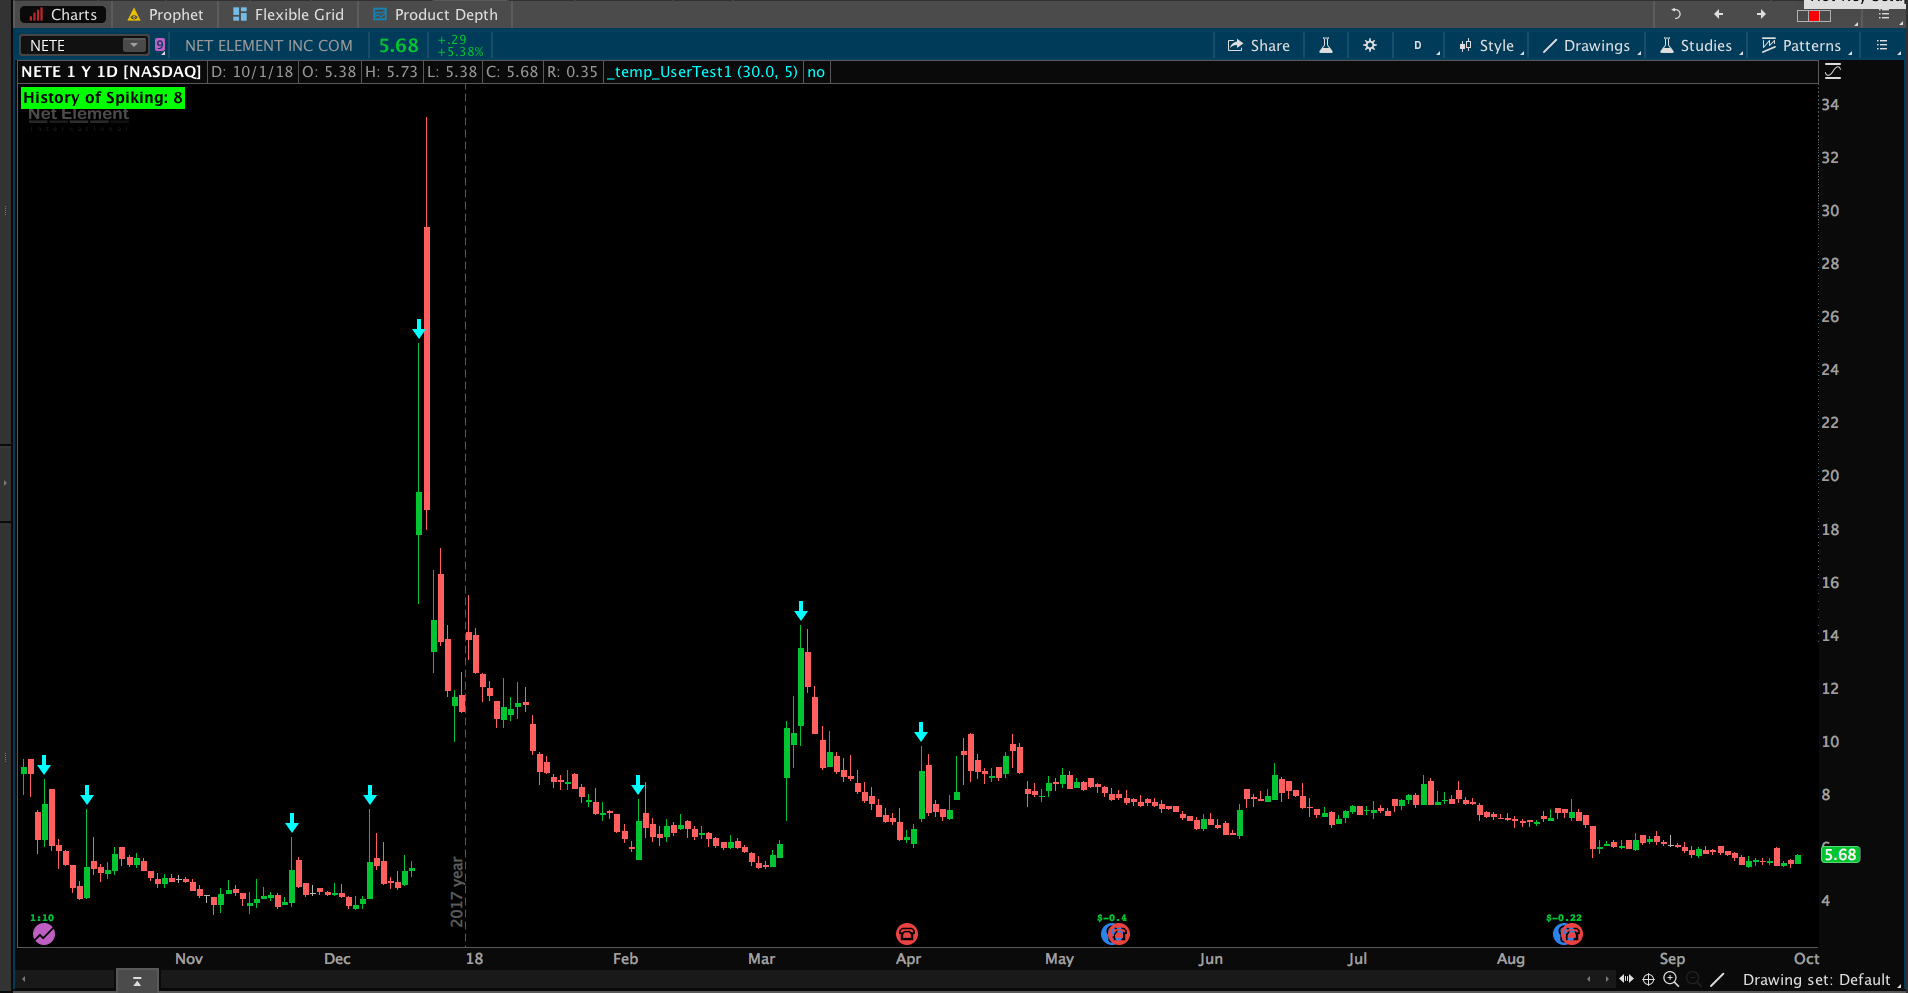
Here it is, with adjustable inputs for percent and count limits:

(screenshot shows the result)

input percentSpike = 30.0;
input countLimit = 5;
def percentRise = 100 * (high / open - 1);
def condition = percentRise >= percentSpike;
rec counter = if condition and BarNumber() >= 0 then counter[1] + 1 else counter[1];
AddLabel(yes, Concat("History of Spiking: ", counter), if counter > countLimit then Color.GREEN else Color.RED);


Attachments:
Marked as spam
Posted by (Questions: 37, Answers: 4087)
Answered on October 1, 2018 8:53 am
0

Is the code taking into account the volume condition, my bad I may have not included it in the new post

Open < high The high is at least 30% or greater than the open The stock has at least 1million shares of daily volume.

( at October 1, 2018 9:00 am)
0

Replace this line:
def condition = percentRise >= percentSpike;

With this line:
def condition = percentRise >= percentSpike and volume > 1000000;

( at October 1, 2018 9:02 am)
0
HI Pete - glad to see you are making a good recovery. I was wondering if you could add a little assistance to this one. I was wondering if there's a way to make it so that it will read on the label the prior spike count based on previous 1y time frame. So, right now if you are using a 1m chart, it will not tell you how many spikes has happened the previous 1y because its all about reading the current chart. Thanks for all your work!
( at August 23, 2019 3:12 am)
0
The code can only read from data that is loaded in the chart. If you cannot load a full 1 year of data on the chart when set to a 1 min time frame, there is no way to force the code to read that far back.
( at August 23, 2019 6:31 am)