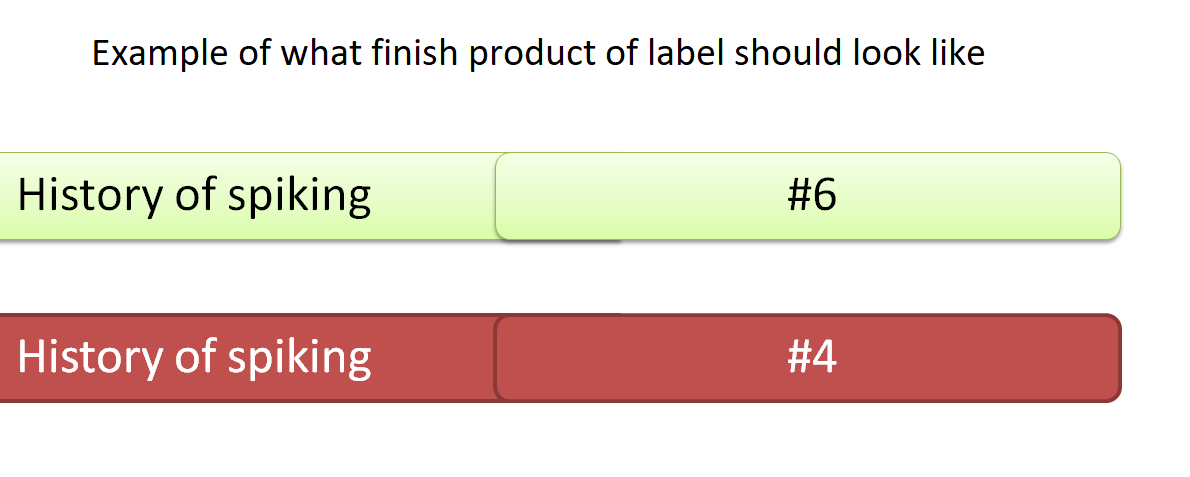
History of price spiking (aka former stock runner) chart label


Category:
0
0

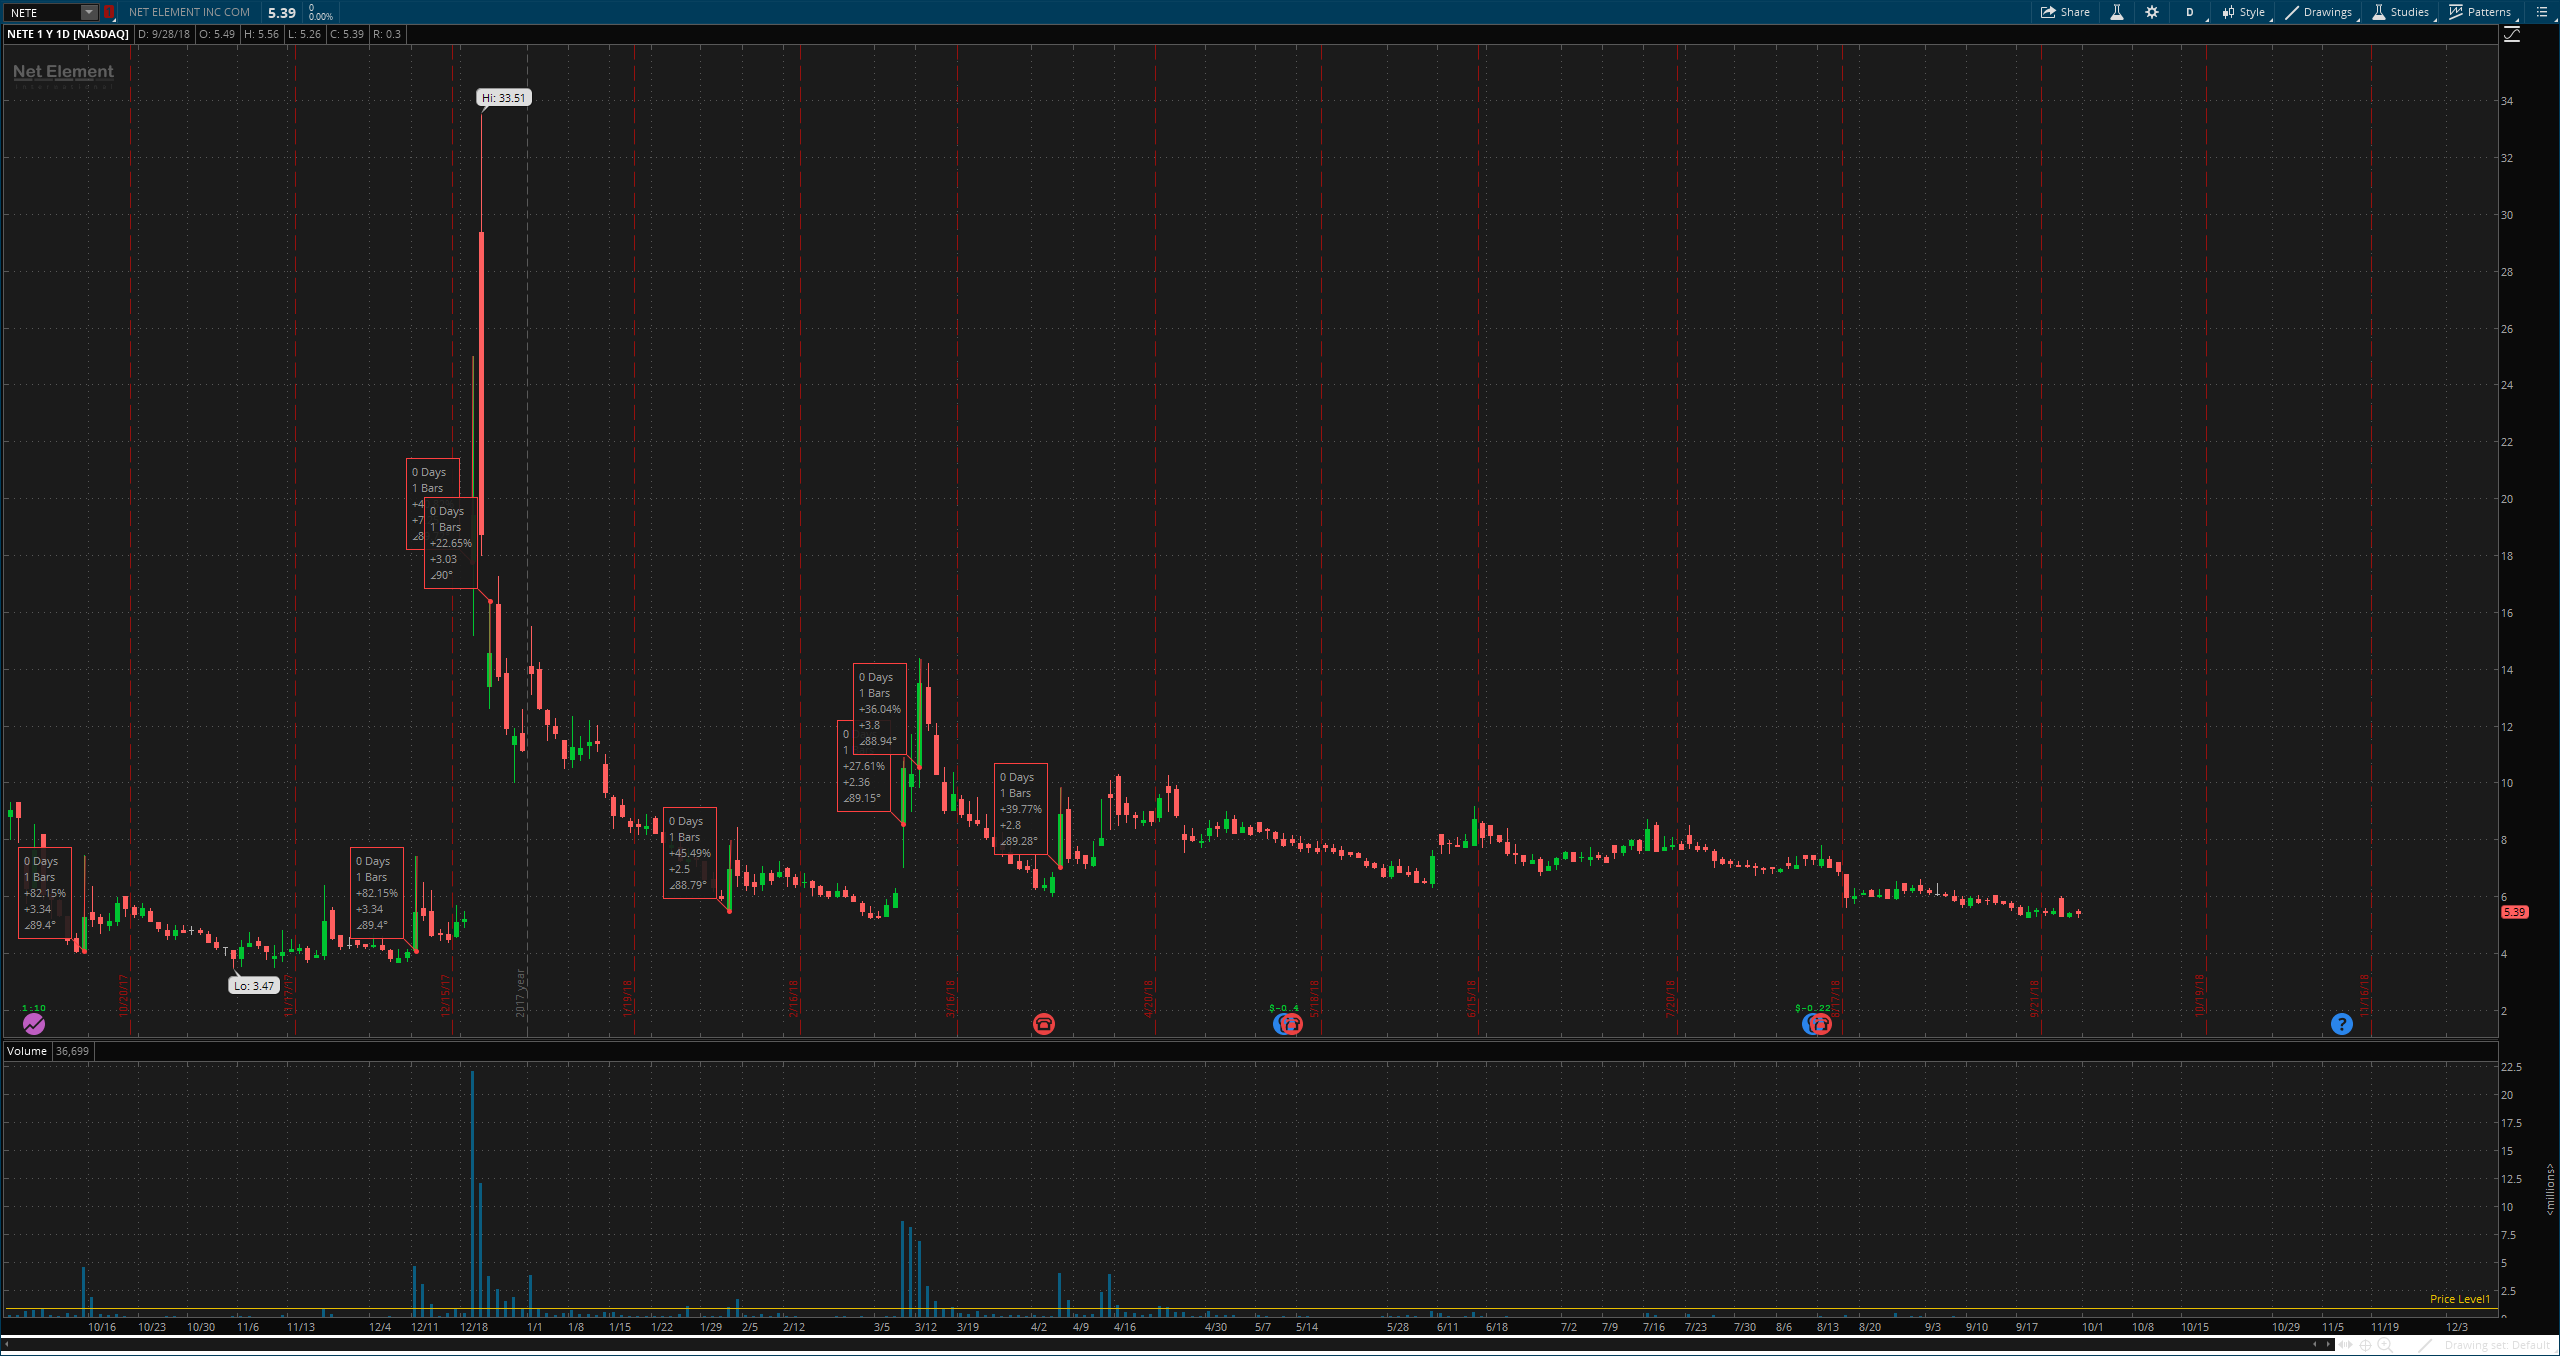
Hello Hahn, when looking to trade a stock a lot of traders look at a stocks previous history for the potential of the stock running up and making large moves to the upside.
The question is how we can create a chart label that displays this historical information?

Condition: How many times in the past year (1year 1day chart) has the stock spiked up 30% or more.

defSpike condition
Open open by at least 30%

Attachments:
Marked as spam
Posted by Juan Banderas (Questions: 22, Answers: 63)
Asked on October 1, 2018 4:58 am
143 views
0
Private answer

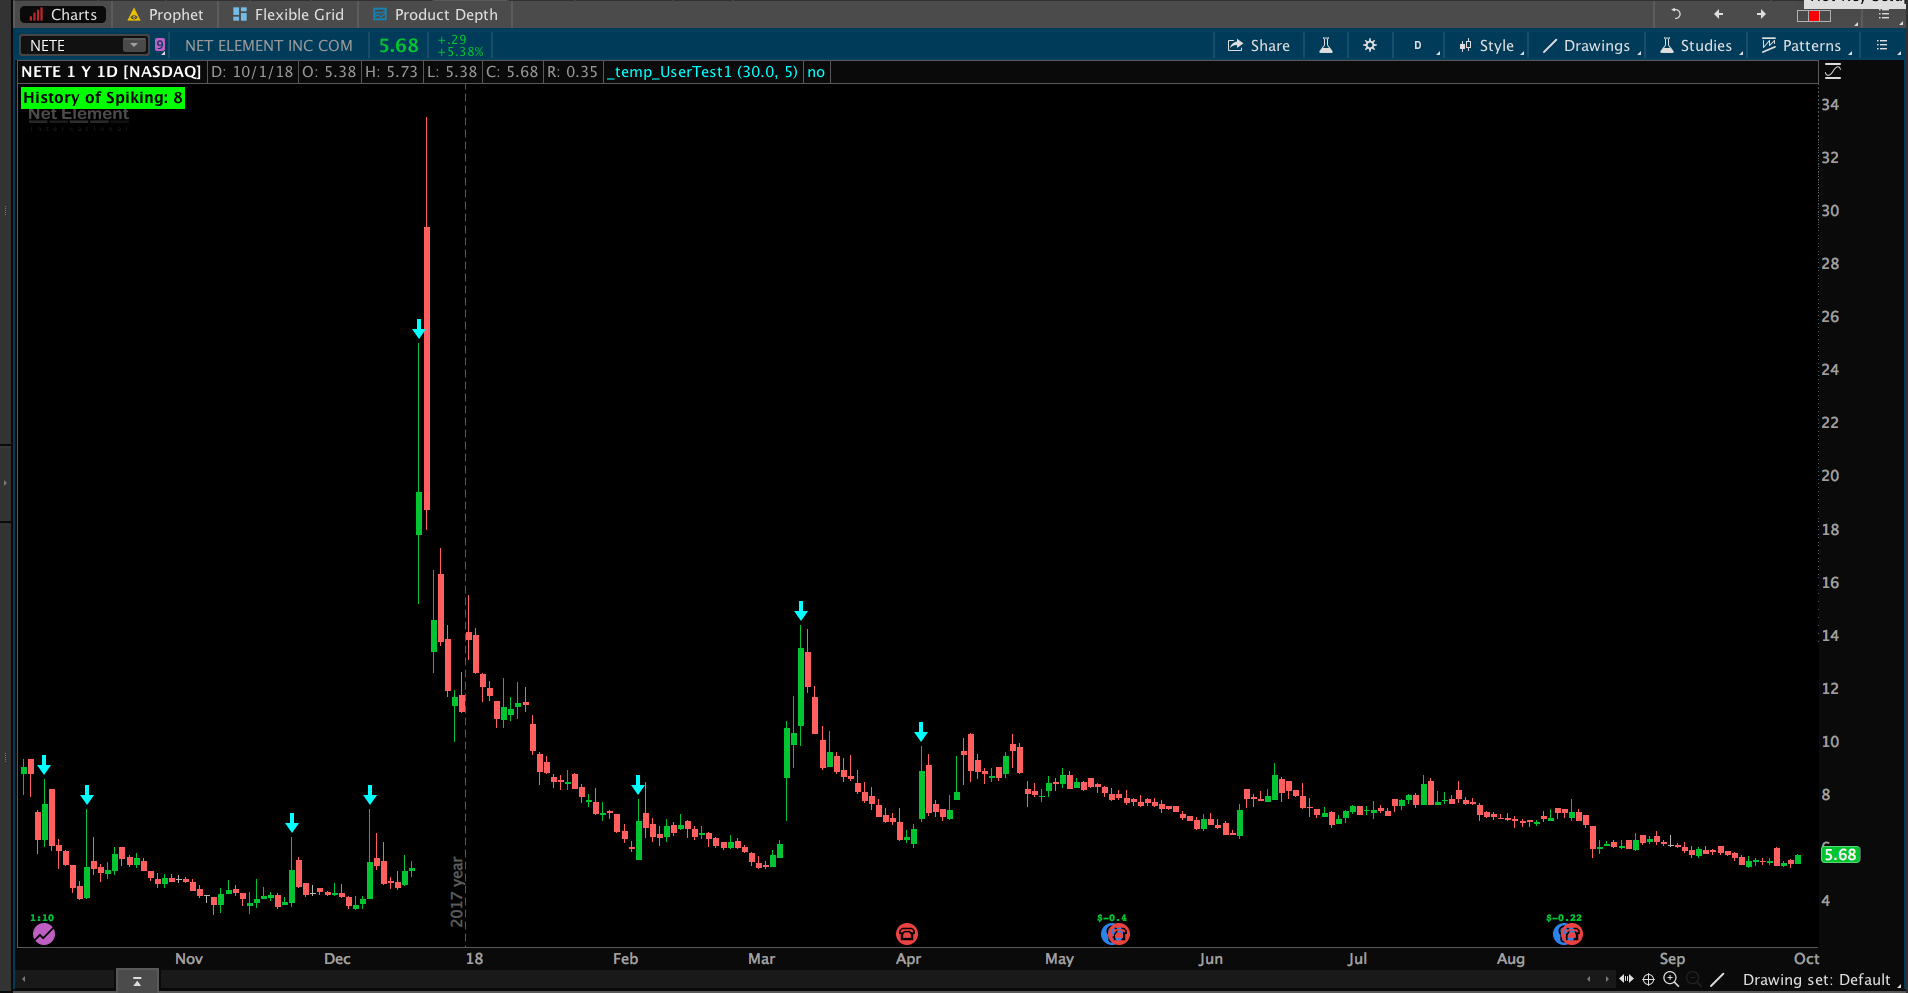
Here it is, with adjustable inputs for percent and count limits:

(screenshot shows the result)

input percentSpike = 30.0;
input countLimit = 5;
def percentRise = 100 * (high / open - 1);
def condition = percentRise >= percentSpike;
rec counter = if condition and BarNumber() >= 0 then counter[1] + 1 else counter[1];
AddLabel(yes, Concat("History of Spiking: ", counter), if counter > countLimit then Color.GREEN else Color.RED);


Attachments:
Marked as spam
Posted by Pete Hahn (Questions: 37, Answers: 4153)
Answered on October 1, 2018 8:53 am
0

Is the code taking into account the volume condition, my bad I may have not included it in the new post

Open < high The high is at least 30% or greater than the open The stock has at least 1million shares of daily volume.

(Juan Banderas at October 1, 2018 9:00 am)
0

Replace this line:
def condition = percentRise >= percentSpike;

With this line:
def condition = percentRise >= percentSpike and volume > 1000000;

(Pete Hahn at October 1, 2018 9:02 am)
0
HI Pete - glad to see you are making a good recovery. I was wondering if you could add a little assistance to this one. I was wondering if there's a way to make it so that it will read on the label the prior spike count based on previous 1y time frame. So, right now if you are using a 1m chart, it will not tell you how many spikes has happened the previous 1y because its all about reading the current chart. Thanks for all your work!
(KC Svi at August 23, 2019 3:12 am)
0
The code can only read from data that is loaded in the chart. If you cannot load a full 1 year of data on the chart when set to a 1 min time frame, there is no way to force the code to read that far back.
(Pete Hahn at August 23, 2019 6:31 am)