| ♥ 0 |
Hi Pete, I’ve been wanting to ask you from a long time. Please how can we make a wachlist or scan that scan on many stocks during last 30days 30minutes candles with TOS ichimoku how many candles are above span A and sort stocks by most numbers that met criteria. thanks a lot
Marked as spam
|
|
Private answer
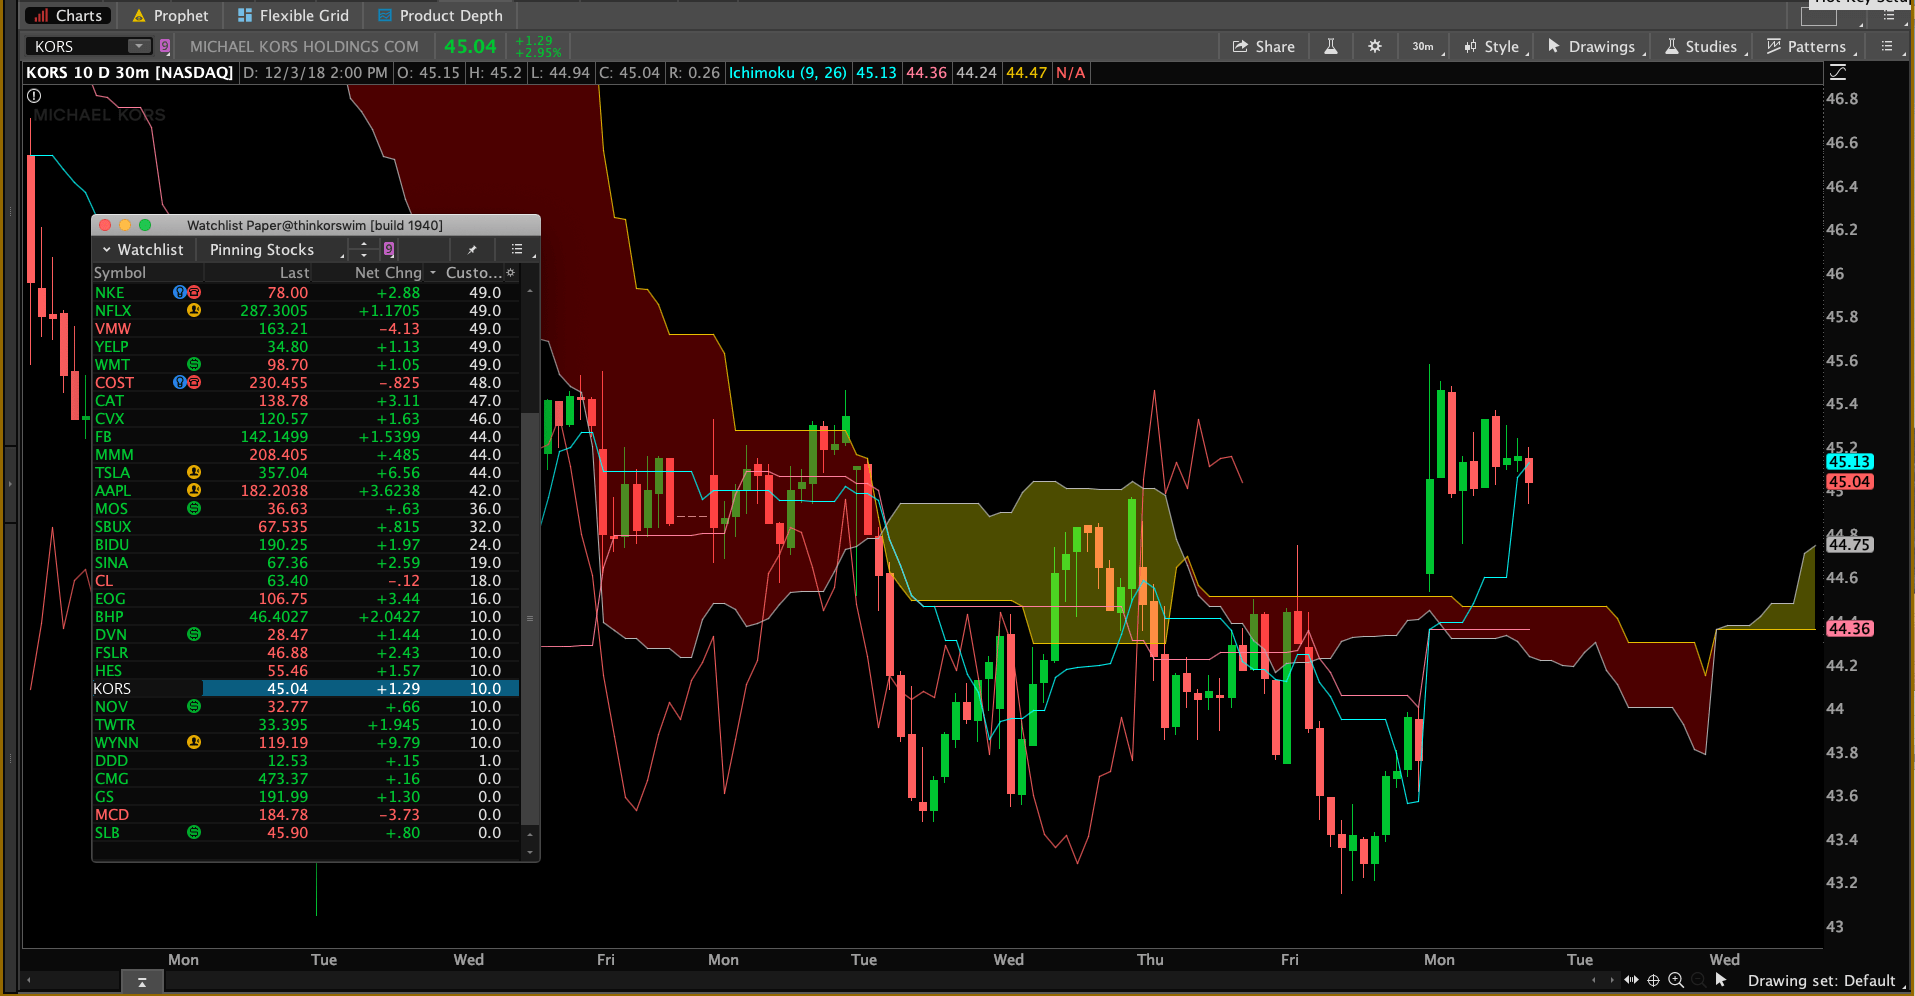
Ok now we have some clarification we can proceed. Each post on this Q&A forum is intended to serve the widest possible audience. So while you have reduced your request to something much less complex, the context of the question will lead viewers to expect the full solution. The first item we must face is the historical data limitation when working with custom watchlists and scans in Thinkorswim. Found at the very bottom of this page: http://toslc.thinkorswim.com/center/howToTos/thinkManual/Scan/Stock-Hacker/studyfilters.html For the 30 min time frame we have only 15 calendar days of historical data available to us. This includes weekends so we don’t even have all 15 days. So we have to accept this limit before we start using this code. The request was for counting the number of candles above Span A. But when the cloud is bearish, Span A is below Span B and this could leave you with candles being counted which are actually inside the cloud. So my solution here is for candles above the cloud, period. So we test if the close is above Span A and we test if the close is above Span B. Both must be true in order for a candle to be counted. Here is the code. Screenshot below shows the result.
Attachments:
Marked as spam
Answered on December 3, 2018 12:19 pm
|
Do you also want to count candles that inside the cloud then? Because during bearish markets the Span A is below Span B. So any candle above Span A during bearish market might also be below Span B.
Hi again Pete. I just saw your ichimoku code that you posted long time ago and it works fine. no need to do another time. sorry that i didnt see it before posting. please can i ask you how can i write close[1] or close[2] or close[3] or close[4] or close[5] ….. to [150] without writing 150 times. thanks a lot and sorry for the delay