| ♥ 0 |
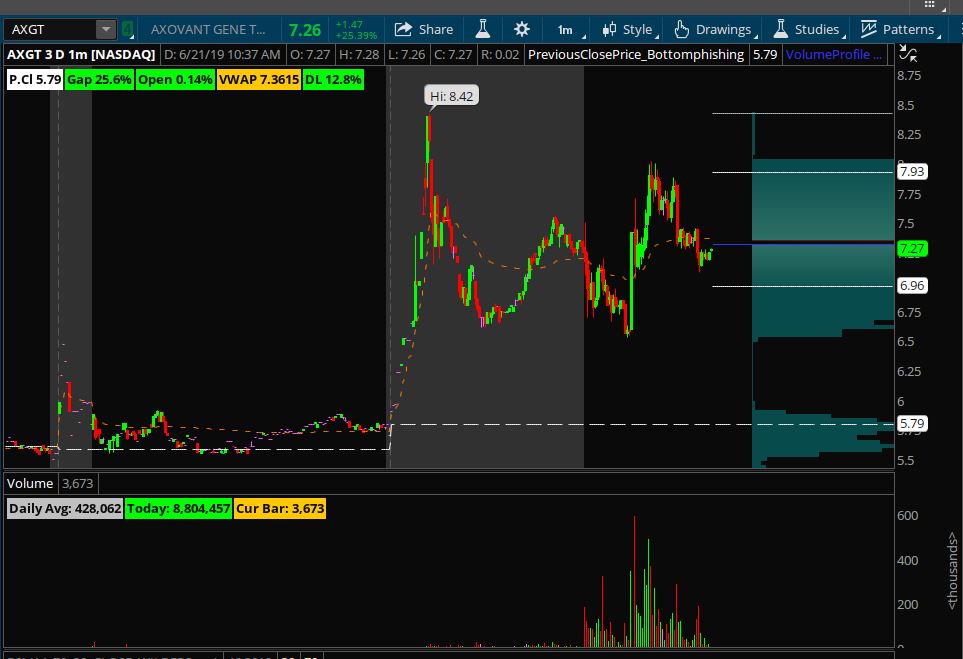
Having trouble getting this to work, I have had success with the open high of day but I need the actual high of day including the p/m action. This 50% pullback line should change as the high of day increases. My study is incorrect because it is showing the pullback as a % I need it to show that in $ amount and draw a line on the chart as well. Thank you for your help I’m just getting started with script! Here’s my code:
input length = 1;#hint length:the number of trading days-ago for the change Plot PctChange = 100 * change*.5; Attachments:
Marked as spam
|
|
Private answer
try this, but there's a limitation you can only have one day of price action, if not it will take higher highs or lower lows from the days prior and and the calculation will change.
def AllTimeHigh = HighestAll(high); Attachments:
Marked as spam
Answered on June 30, 2019 6:31 pm
|
Well I have some code for you that will plot the high of day including the extended hours session. (extended hours session includes previous day's post-market hours along with current day's pre-market hours).
As to the 50% pull back line. I think you have not clearly defined how that should be computed. You did include some code and explained that the code computed that value as a percent rather than a value. It seems from your code that this percent is computed using the previous day's close. So does that mean you want this so-called "Death Line" to be computed as the midway point between the previous day's close and the current day's high?
Once I get this clarified I will change your question's title to better reflect the context of your question and make it easier for other viewers to search for and find this post.