50 EMA within 0.5 percent of VWAP


Category:
0
0

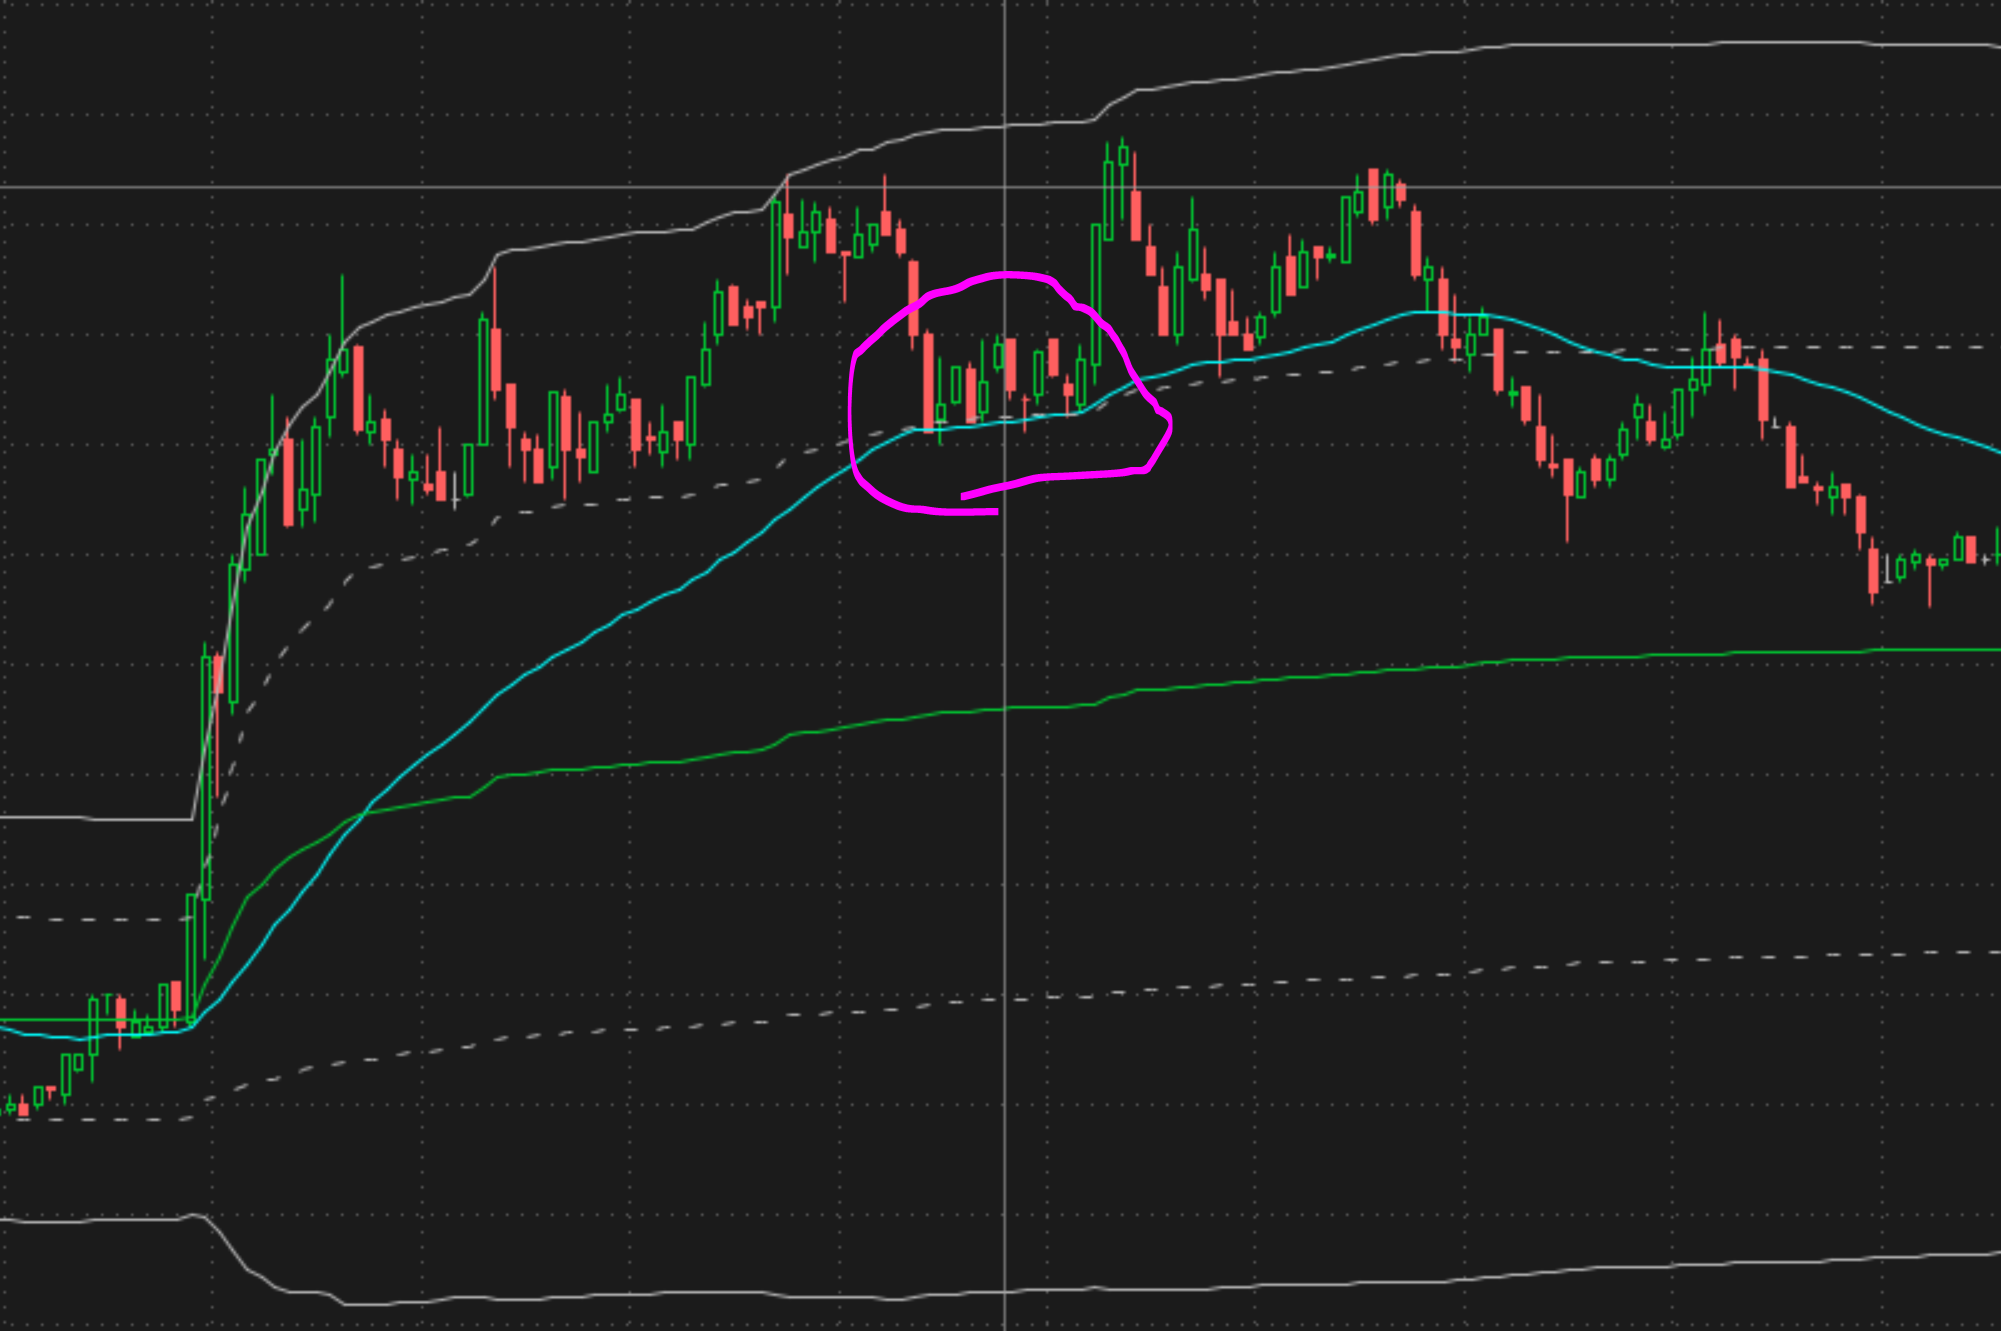
Hi Hahn,

I’m trying to make a scan to find all stocks that have the 50EMA within .5% of the VWAP and the +/- 1 & 2 standard deviations for more than 15 bars.

I have my VWAP setup to show the +/- 1 & 2 standard deviations. I find that its likely to have the stock react to these levels. When the 50 EMA is running inline with one of these other lines the chances of a reaction is higher.

I’ve included an example image to help you visualize what I’m going for.

Thanks for the help Hahn!!

Attachments:
Marked as spam
Posted by (Questions: 2, Answers: 0)
Asked on September 15, 2021 5:24 pm
185 views
0
Private answer

I can provide a solution for one of the plots on the VWAP study. You will have to work out the rest yourself. I only get 15 minutes to provide each free solution in the Q&A Forum and this is what I was able to complete in that brief amount of time:

input percentThreshold = 0.5;
input consecutiveBars = 15;
input numDevDn = -2.0;
input numDevUp = 2.0;
input timeFrame = {default DAY, WEEK, MONTH};
input maLengthOne = 50;
input maTypeOne = AverageType.EXPONENTIAL;
input maPriceOne = close;
def vwapPlot = reference VWAP(numDevDn, numDevUp, timeFrame).VWAP;
def upperPlot = reference VWAP(numDevDn, numDevUp, timeFrame).UpperBand;
def lowerPlot = reference VWAP(numDevDn, numDevUp, timeFrame).LowerBand;
def maOne = MovingAverage(maTypeOne, maPriceOne, maLengthOne);
def percentDiff = 100 * (maOne / vwapPlot - 1);
def pattern = AbsValue(percentDiff) < percentThreshold * 0.01;
plot scan = Lowest(pattern, consecutiveBars) > 0;

This covers the main plot of the VWAP study. I have included variables for the upper and lower bands to make it easier for you to adjust the code to work with those plots. I have included a user input for the percent threshold as well as the consecutive bars. Standard inputs were included to adjust the VWAP study and the moving average.

Marked as spam
Posted by (Questions: 37, Answers: 4084)
Answered on September 16, 2021 10:44 am