| ♥ 0 |
Hey Pete! Thanks for all your help as always.
You helped me on a previous AccDist scan and I’ve tried everyday I could think of to get the modified scan to work.
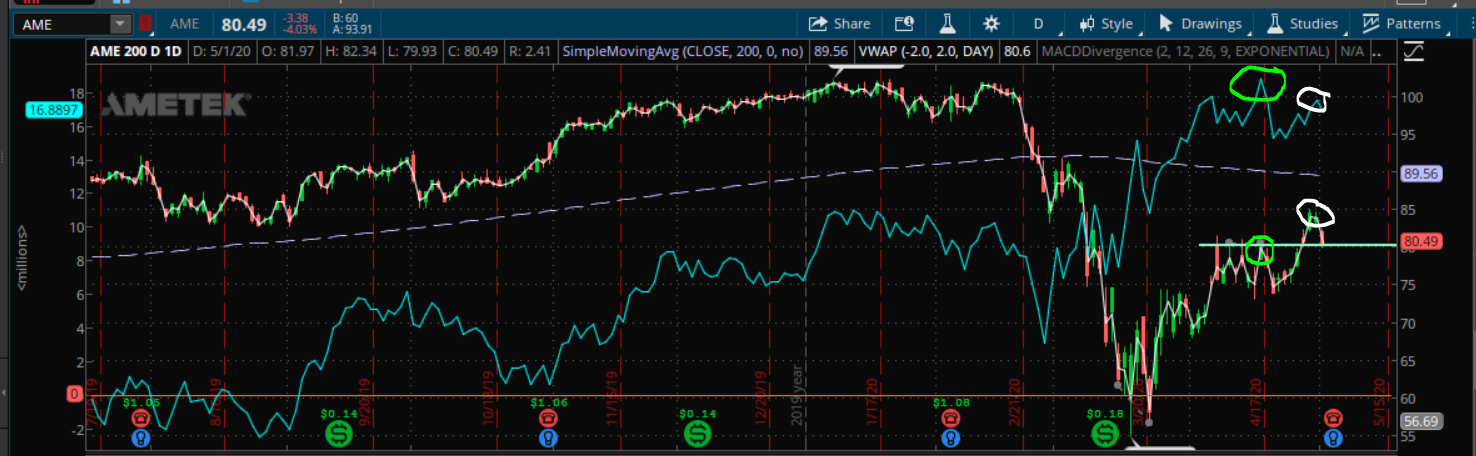
All I’m trying to get is the highest AccDist value from the previous 30 days and that day’s price and compare it against the current day’s price and it’s current AccDist value. Below is a screenshot, the lime circles are the highest/accdist and the price and the white is the current accdist and its price.
I’ve fiddled around with the script below but it determines accdist off of price instead of price off of AccDist.
Hope this makes sense.
def yearlyLowPrice = Lowest(low, 251);
Attachments:
Marked as spam
|
|
Private answer
Sorry but I cannot think of a simple way to do this. Divergence takes a great deal of complexity to measure properly. But your approach is one that allows for a result that is far less precise than true divergence studies such as the ones we publish in our premium indicators page: https://www.hahn-tech.com/premium-chart-indicators/ I was able to come up with a solution that finds the specific divergence pattern you have described in your question. Here is the code to achieve what you have requested:
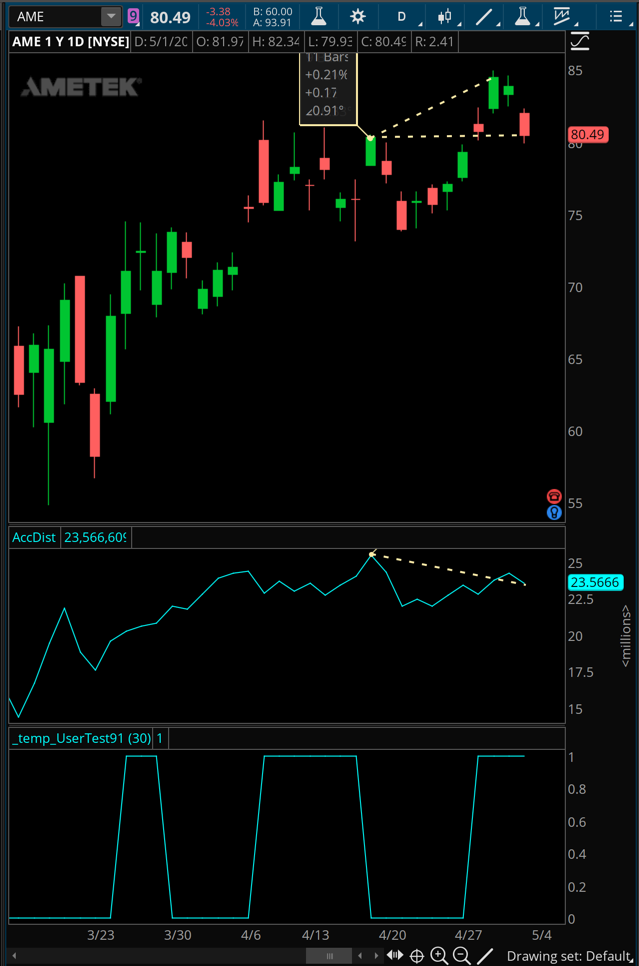
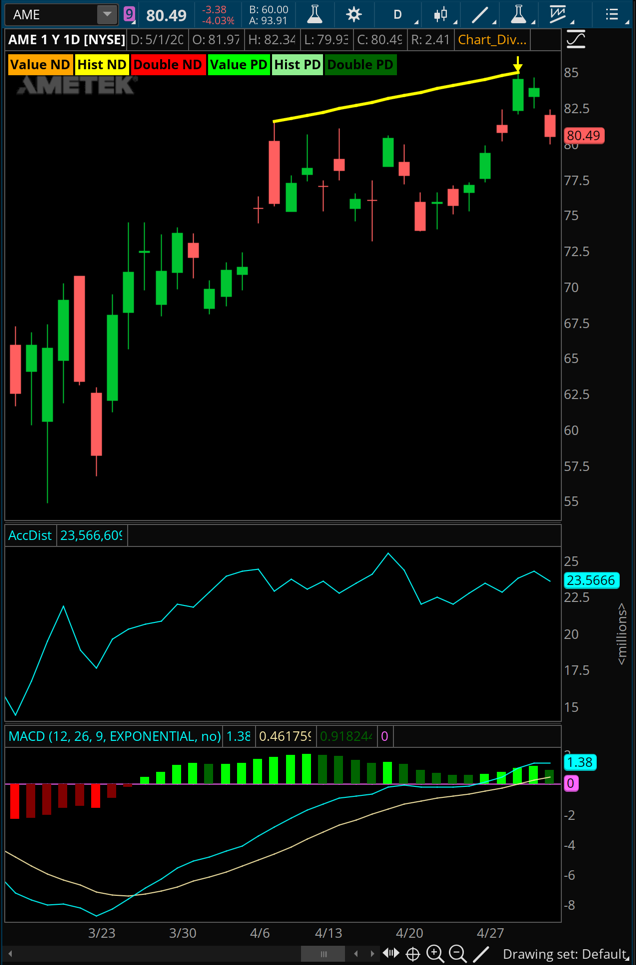
I am including two screenshots below. One that shows the result of this piece of code. (dashed yellow trendlines were drawn by hand). The blue line on the lower subgraph below the AccDist indicator shows the places where this scan will return a true result. For reference I am also included a screenshot showing our premium divergence study based on the MACD. (solid yellow line is drawn by the code automatically) We can also make customized versions of these premium divergence indicators. AccDist is a candidate for just this sort of customization. Attachments:
Marked as spam
Answered on May 3, 2020 10:30 am
|