| ♥ 0 |
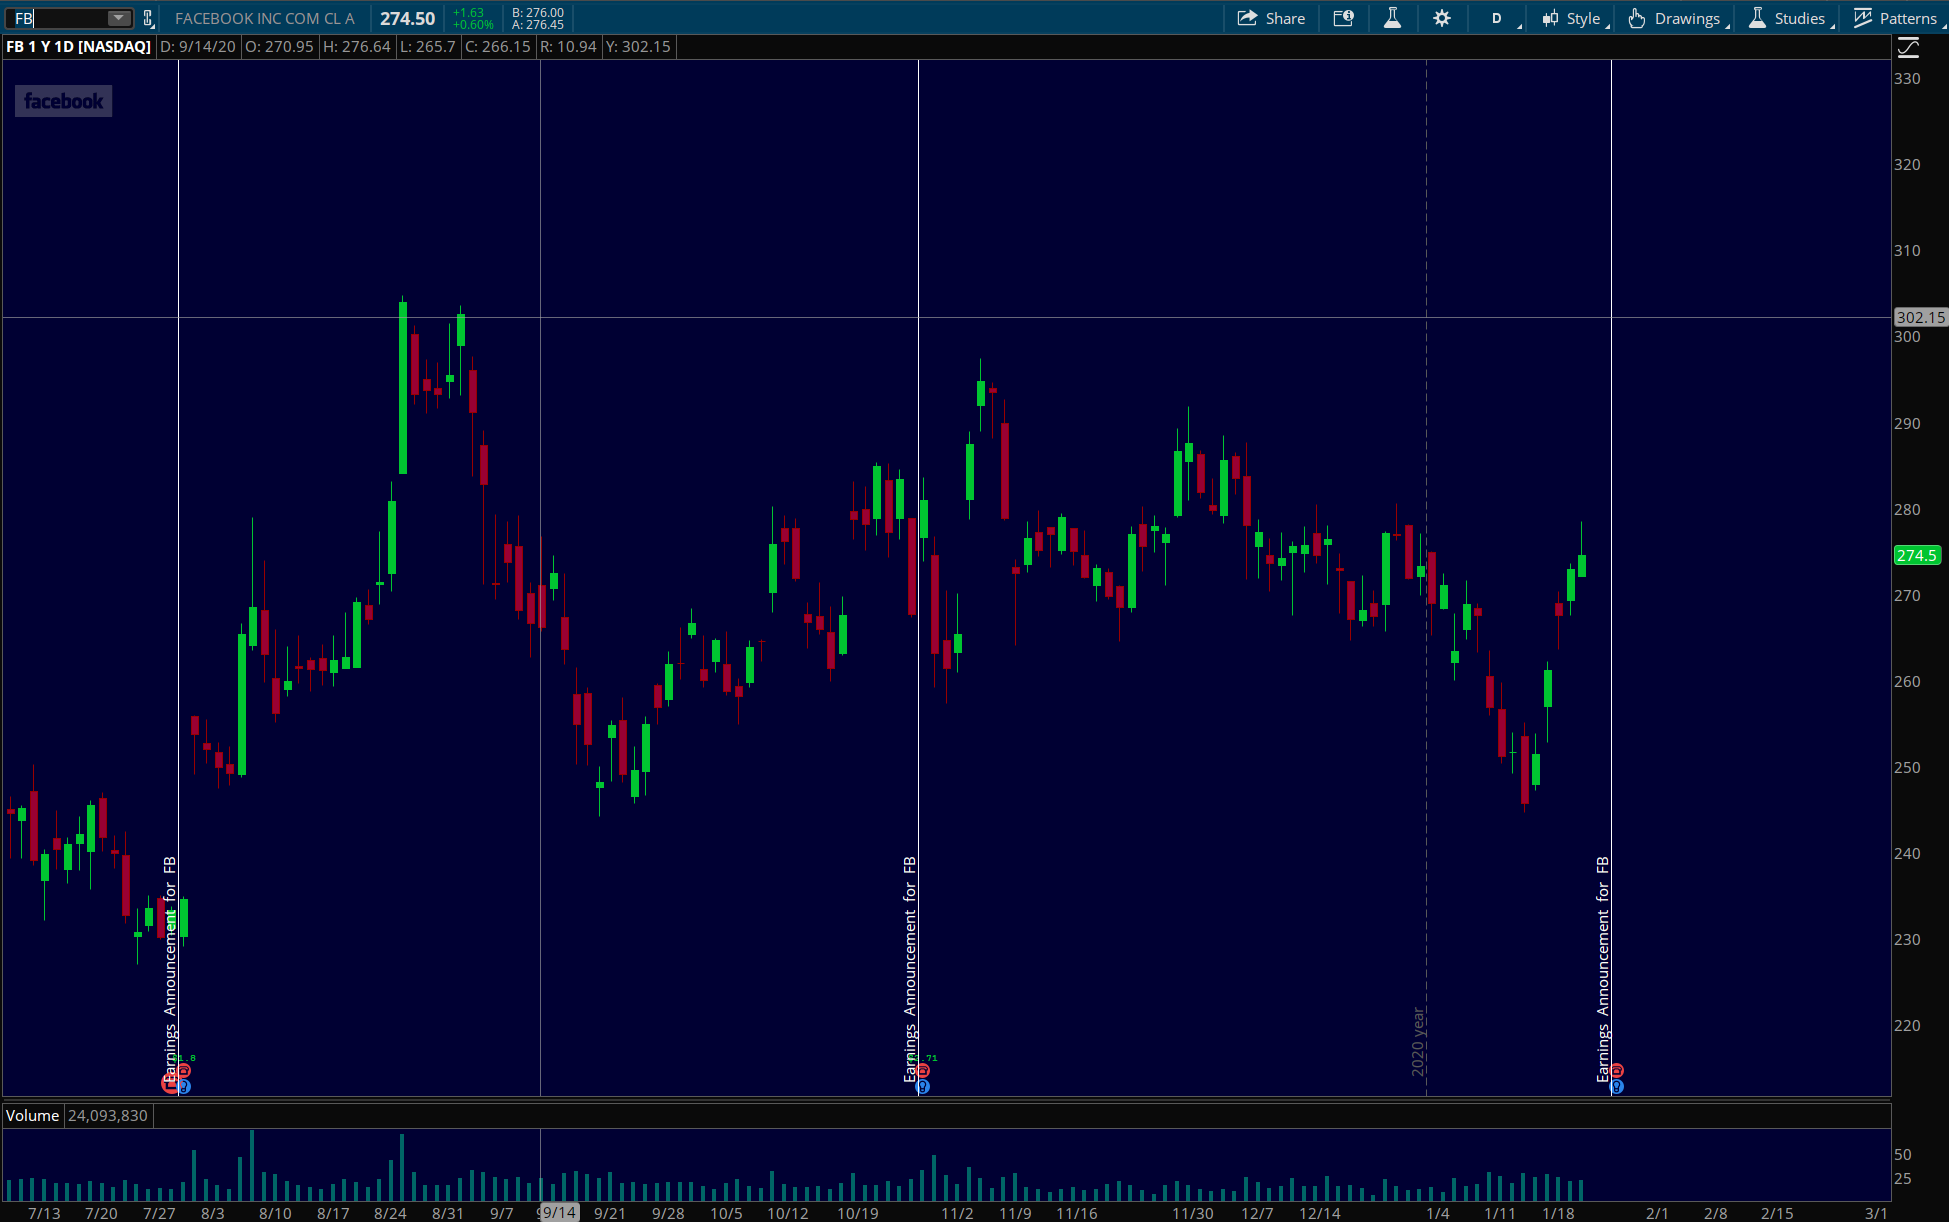
Hi Pete, Is it possible to use AddChartBubble() and add a bubble onto the vertical line? if no, are there any work arounds? If yes, maybe you have screenshots to share what it looks like? Check screenshot. Attachments:
Marked as spam
Asked on January 23, 2021 5:21 am
316 views
|
|
Private answer
The name of the function that places chart bubbles on the chart is named "AddChartBubble()". Full details available here: https://toslc.thinkorswim.com/center/reference/thinkScript/Functions/Look---Feel/AddChartBubble In the specifications you will find that chart bubbles are tied to a date/time location on the chart as well as a price. That forms the x and y coordinates for placing any chart bubble on the chart. So there is no way to specifically attached a chart bubble to a vertical line. You can use the same logic used to place the vertical line at a date/time location on the chart. But the chart bubble itself must be tied to a value relative to one of the four data points of a candle: Open, High, Low or Close. Since you did not provide an example of the code you are using there is nothing more for me to do except provide you this general overview of how to work with chart bubbles on Thinkorswim. Marked as spam
Answered on January 23, 2021 11:12 am
|