Add chart label for Relative Volatility Index


Category:
0
0

Hello and thank you for the help,

I would just like a study indicator that places a rectangular label on the top left side of the chart that shows the current bar’s RVI in just one square box. The box shoud change colors depending on the values below Relative Volatility Index (RVI) above 55 then background color red Relative Volatility Index (RVI) below 45 then background color green.

Marked as spam
Posted by (Questions: 22, Answers: 63)
Asked on March 20, 2018 12:45 pm
571 views
0
Private answer

Ok so we’ll give a link to the original post here because we going to use that code: https://www.hahn-tech.com/ans/relative-volatility-index-rvi-custom-watch-list/

Only a few minor tweaks are required to get this converted from watchlist column to chart label.

Here is the code from that other post:

input stDevLength = 10;
input averageLength = 14;
input averageType = AverageType.EXPONENTIAL;
def stDevHi = stDev(high, stDevLength);
def stDevLo = stDev(low, stDevLength);
def avgStDevHiUp = MovingAverage(averageType, if high > high[1] then stDevHi else 0, averageLength);
def avgStDevHiDown = MovingAverage(averageType, if high < high[1] then stDevHi else 0, averageLength);
def avgStDevLoUp = MovingAverage(averageType, if low > low[1] then stDevLo else 0, averageLength);
def avgStDevLoDown = MovingAverage(averageType, if low < low[1] then stDevLo else 0, averageLength);
def rviHi = if avgStDevHiUp + avgStDevHiDown == 0 then 50 else 100 * avgStDevHiUp / (avgStDevHiUp + avgStDevHiDown);
def rviLo = if avgStDevLoUp + avgStDevLoDown == 0 then 50 else 100 * avgStDevLoUp / (avgStDevLoUp + avgStDevLoDown);
plot RVI = (rviHi + rviLo) / 2;
AssignBackgroundColor(if RVI > 55 then Color.RED else if RVI < 45 then Color.GREEN else Color.BLACK);

So, there is only TWO changes. We replace the final statement statement “AssignBackgroundColor()” with a new statement that places the chart label on the chart.

So remove this:

AssignBackgroundColor(if RVI > 55 then Color.RED else if RVI < 45 then Color.GREEN else Color.BLACK);

Then add this:

AddLabel(yes, Concat("RVI: ", RVI), if RVI > 55 then Color.RED else if RVI < 45 then Color.GREEN else Color.BLACK);

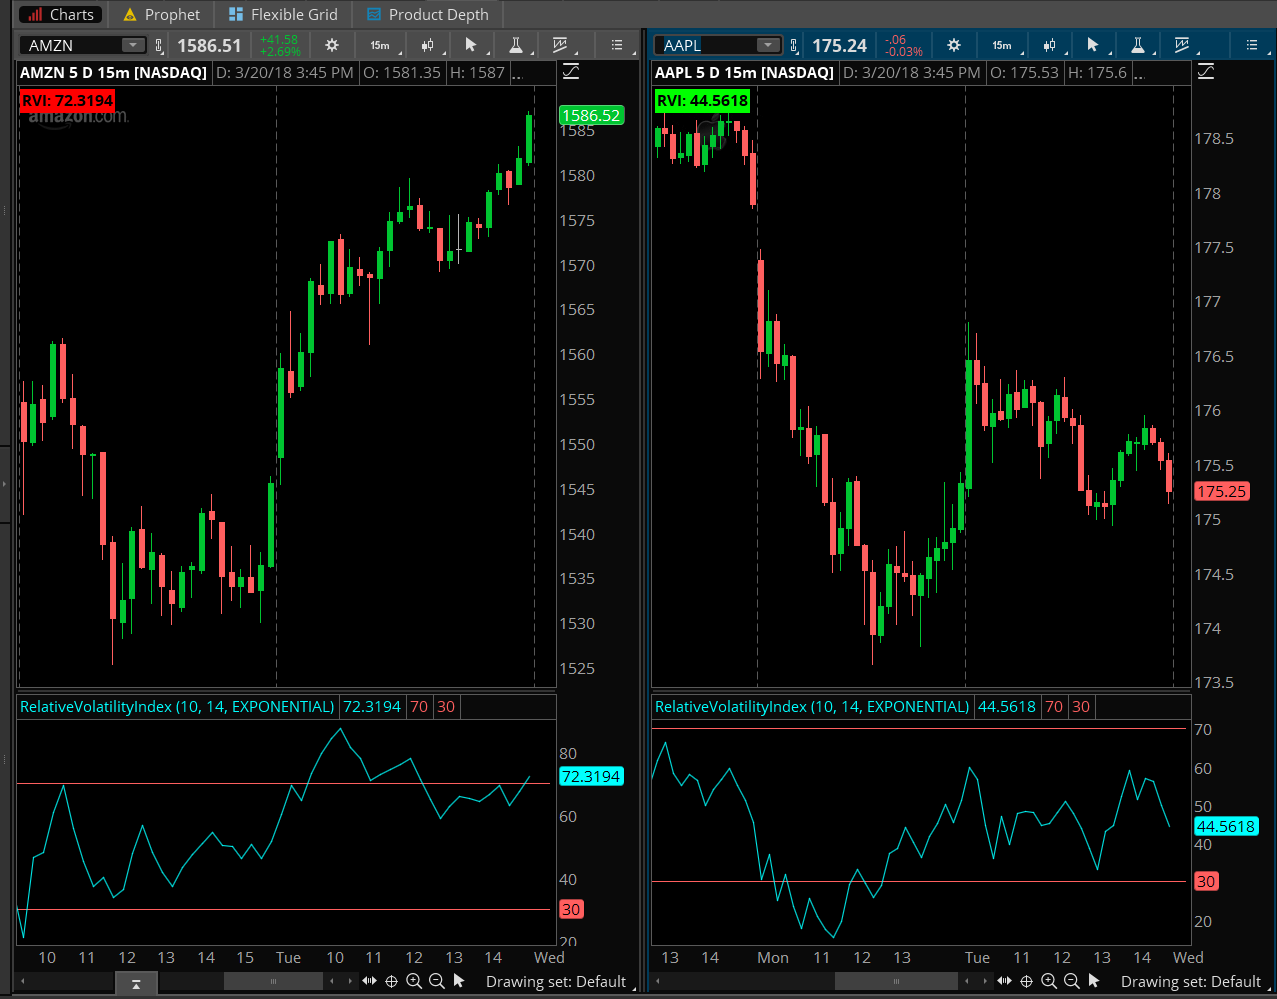
The second change is to locate this line:plot RVI = (rviHi + rviLo) / 2;

And replace it with this line: def RVI = (rviHi + rviLo) / 2;

(all we did was change the plot to def)

Screenshot below is how it appears on the upper price graph. The lower plot graph is not included. I simply added the built in version that comes with Thinkorswim so you can see the current values match the chart label.

Attachments:
Marked as spam
Posted by (Questions: 37, Answers: 4086)
Answered on March 20, 2018 5:37 pm