| ♥ 0 |
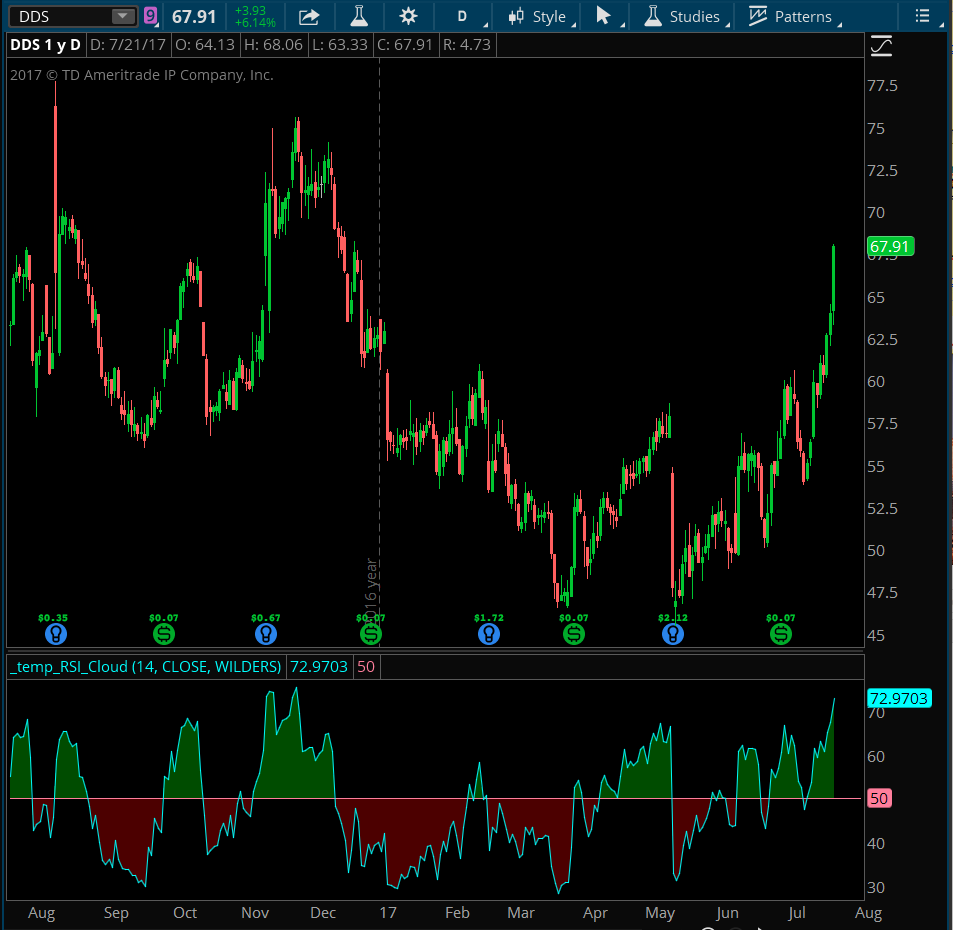
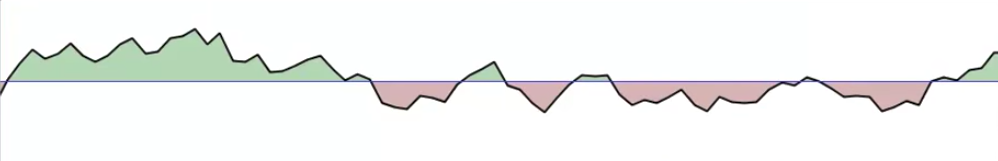
Please see attached file. I can’t figure out how to have the same RSI as the attached screenshot. Remove level 70 and 30 and just have it colors when crosses line 50. Please advise. Thank you.
Attachments:
RESOLVED
Marked as spam
Asked on July 22, 2017 2:24 pm
2263 views
|
|
Private answer
Here we go. Just leveraging the code that is included with the built in RSI study. I’ve only added a centerline variable and an AddCloud() statement. You can read more about the AddCloud() function here: http://toslc.thinkorswim.com/center/reference/thinkScript/Functions/Look—Feel/AddCloud.html Here is the code, and screenshot show the output.
Attachments:
Marked as spam
Answered on July 22, 2017 3:18 pm
|
|
|
Private answer
That’s nice. Thank you, Pete! Marked as spam
Answered on July 22, 2017 5:25 pm
|