Adding a Fibs Column in Scan Search Results


Category:
0
0

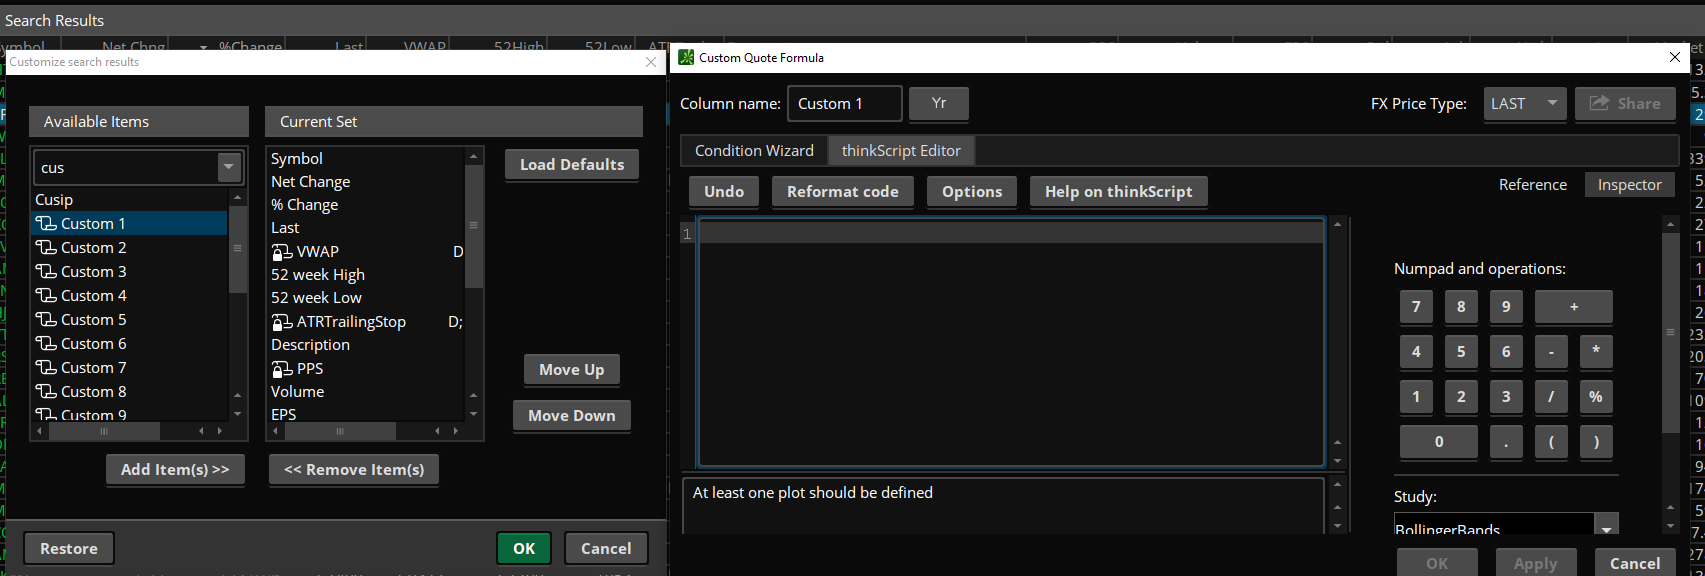
Hi Pete, I am trying to add a custom column in scan search results which shows 50 and 61.8 % fibs of Yearly high low as separate columns. I have reached up to the stage shown in the screenshot attached.

Please help on the think script.

Thank you,
Shaishav

Attachments:
Marked as spam
Posted by (Questions: 49, Answers: 62)
Asked on December 12, 2020 4:01 pm
54 views
0
Private answer

Since you are using the yearly time frame the solution is very simple:

plot data = (high - low) * 0.5 + low;

Simply change the value of 0.5 to whatever percent you want to compute and display.

Marked as spam
Posted by (Questions: 37, Answers: 4087)
Answered on December 12, 2020 5:14 pm
0
Thank you so much
( at December 12, 2020 5:26 pm)
0
Is there a possibility to provide the solution for the 50 % fib in between the swing high and swing low?
( at December 12, 2020 7:52 pm)
0
Certainly that is possible. However you first need to define exactly is a "swing high and a swing low". But the solution to this is way beyond the scope of what I can provide free of charge in the Q&A Forum.
( at December 12, 2020 9:46 pm)