After receiving further details I have updated the title of the question to reflect the context of the request. I have also moved this to the Chart Studies topic.
So based on the clarifications, what we have in the following code is a Chart Study that plots the VWAP study. (exactly as the built-in study provided by Thinkorswim). It displays up and down arrows at places where the closing price of a candle crosses above or below the VWAP plot. Alerts are also included, and per the request the alerts will not trigger until the candle that crosses the VWAP plot has closed and the next bar has opened.
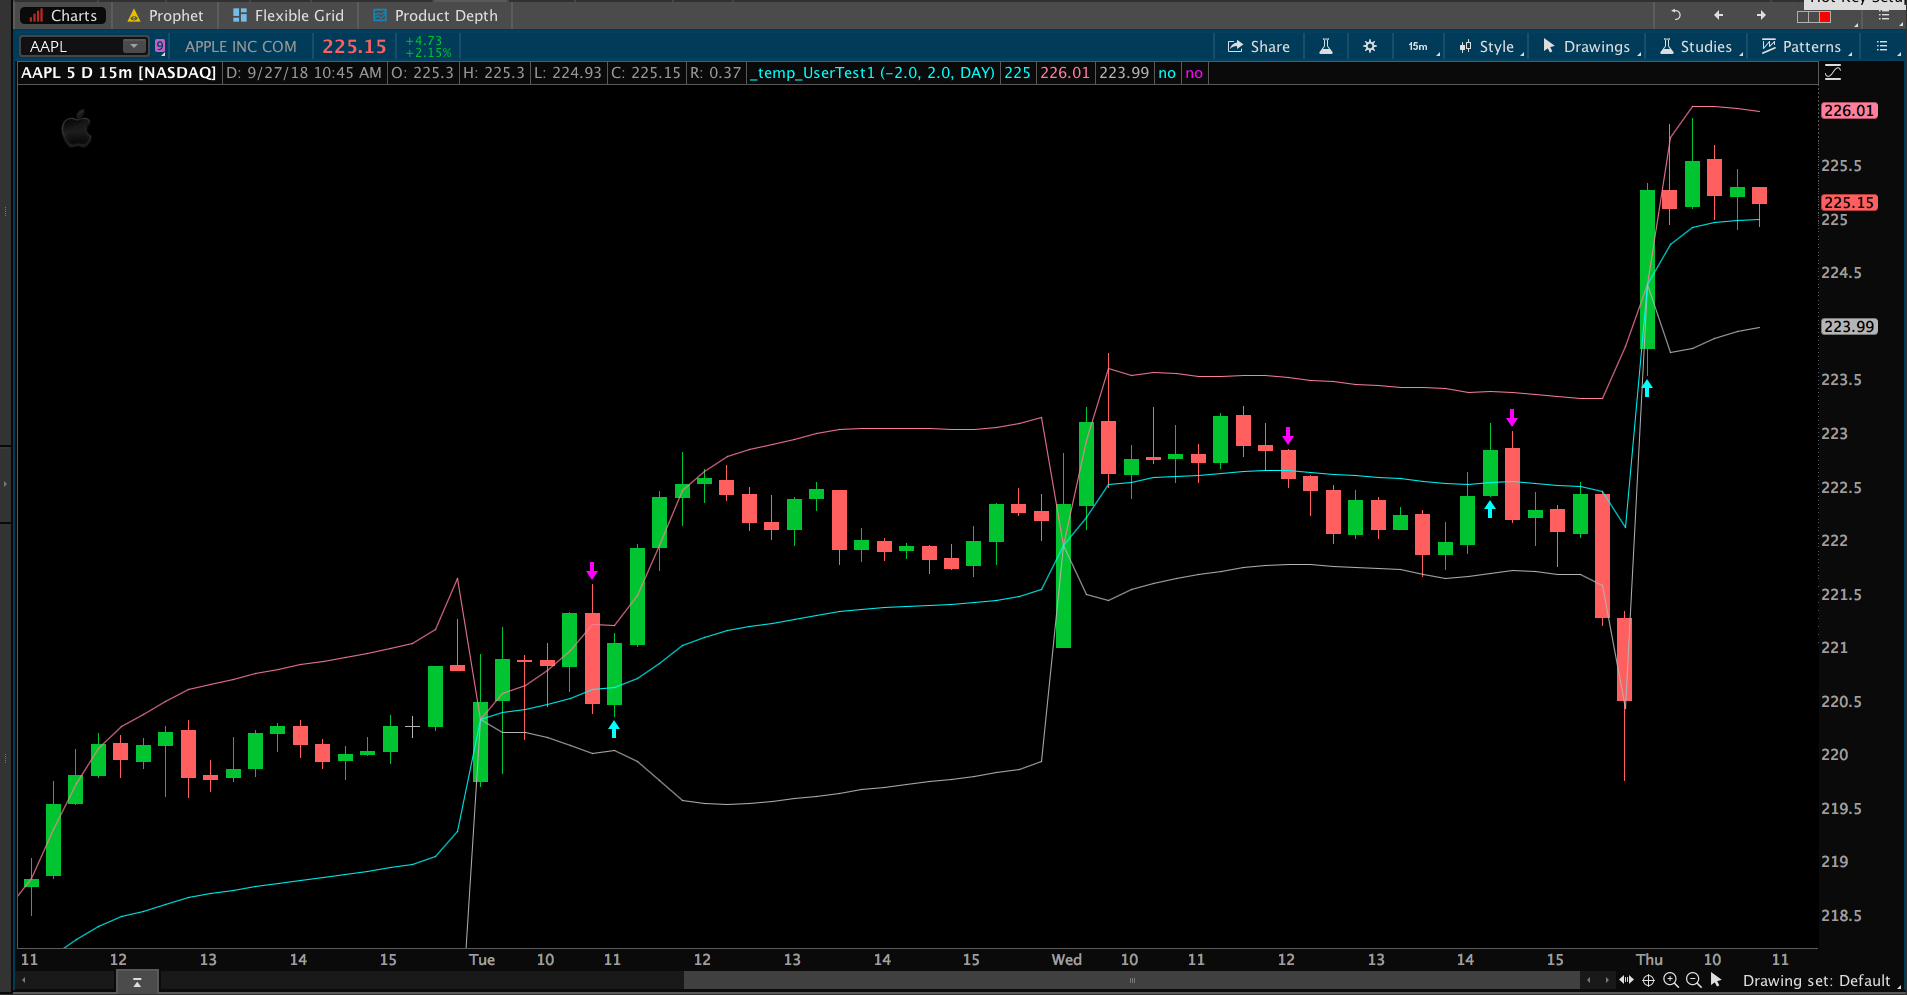
Here is the full code. Screenshot below shows the result.
input numDevDn = -2.0;

input numDevUp = 2.0;

input timeFrame = {default DAY, WEEK, MONTH};

def cap = getAggregationPeriod();

def errorInAggregation =

timeFrame == timeFrame.DAY and cap >= AggregationPeriod.WEEK or

timeFrame == timeFrame.WEEK and cap >= AggregationPeriod.MONTH;

assert(!errorInAggregation, "timeFrame should be not less than current chart aggregation period");

def yyyyMmDd = getYyyyMmDd();

def periodIndx;

switch (timeFrame) {

case DAY:

periodIndx = yyyyMmDd;

case WEEK:

periodIndx = Floor((daysFromDate(first(yyyyMmDd)) + getDayOfWeek(first(yyyyMmDd))) / 7);

case MONTH:

periodIndx = roundDown(yyyyMmDd / 100, 0);

}

def isPeriodRolled = compoundValue(1, periodIndx != periodIndx[1], yes);

def volumeSum;

def volumeVwapSum;

def volumeVwap2Sum;

if (isPeriodRolled) {

volumeSum = volume;

volumeVwapSum = volume * vwap;

volumeVwap2Sum = volume * Sqr(vwap);

} else {

volumeSum = compoundValue(1, volumeSum[1] + volume, volume);

volumeVwapSum = compoundValue(1, volumeVwapSum[1] + volume * vwap, volume * vwap);

volumeVwap2Sum = compoundValue(1, volumeVwap2Sum[1] + volume * Sqr(vwap), volume * Sqr(vwap));

}

def price = volumeVwapSum / volumeSum;

def deviation = Sqrt(Max(volumeVwap2Sum / volumeSum - Sqr(price), 0));

plot vwapValue = price;

plot upperBand = price + numDevUp * deviation;

plot lowerBand = price + numDevDn * deviation;

plot crossingAbove = close[1] < vwapValue[1] and close > vwapValue;

crossingAbove.SetPaintingStrategy(PaintingStrategy.BOOLEAN_ARROW_UP);

crossingAbove.SetDefaultColor(Color.CYAN);

crossingAbove.SetLineWeight(3);

plot crossingBelow = close[1] > vwapValue[1] and close < vwapValue;

crossingBelow.SetPaintingStrategy(PaintingStrategy.BOOLEAN_ARROW_DOWN);

crossingBelow.SetDefaultColor(Color.MAGENTA);

crossingBelow.SetLineWeight(3);

Alert(crossingAbove[1], "Cross Above VWAP", Alert.BAR, Sound.RING);

Alert(crossingBelow[1], "Cross Below VWAP", Alert.BAR, Sound.RING);
This can be built using the condition wizard. No need to write any lines of code at all.
Did you really want to be alerted for every single bar that closed above the VWAP and every single bar that closes below it? Because that’s how your request is structured. Really makes little sense at all. Since every single bar on the chart will be triggering an alert. Also, did you want this to be just a chart study alert? Or did you have plans for receiving text/email notifications instead?
I should have termed it as a cross, i.e., previous price bar closes below the VWAP and then next price bar closes above the VWAP. No alert until next price bar ends. Alert comes as a sound. A chart arrow (up/down) would be useful. Just like the “show breakout signals” feature for closes above/below moving averages in TOS.