| ♥ 0 |
Hi Pete, Is there a way to create an alert for when the weekly stochastic %K hits 80% (coming up from below)? I think I was able to adjust a prior posting for when the weekly stochastic %K is oversold and then comes back up and hits 20% but I just wanted to confirm if what I changed to make it alert when %K hits 80% is correct. Thank you Attachments:
RESOLVED
Marked as spam
Asked on September 19, 2017 11:51 am
1158 views
|
|
Private answer
This is a very common request. Everyone wants one of these. Therefore, we have received numerous requests. I’m sure if you look around on the floor you will find them lying around like dust bunnies. Kidding…. sort of. Please be sure to use the search box at the top of each forum topic to see if your question has already been posted and answered before submitting a new question. In your particular case, I would direct you to the following posts: https://www.hahn-tech.com/ans/scan-for-stochasticfast/ https://www.hahn-tech.com/ans/stochastic-momentum-index-bearish-bullish-crossover-scan/ https://www.hahn-tech.com/ans/alert-fullk-crosses-fulld-overbought/ If you don’t find your solution in any of these posts be sure to get back to us and explain in more detail. Thanks! Marked as spam
Answered on September 19, 2017 8:27 pm
|
|||
|
Private answer
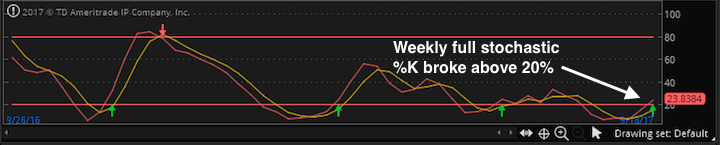
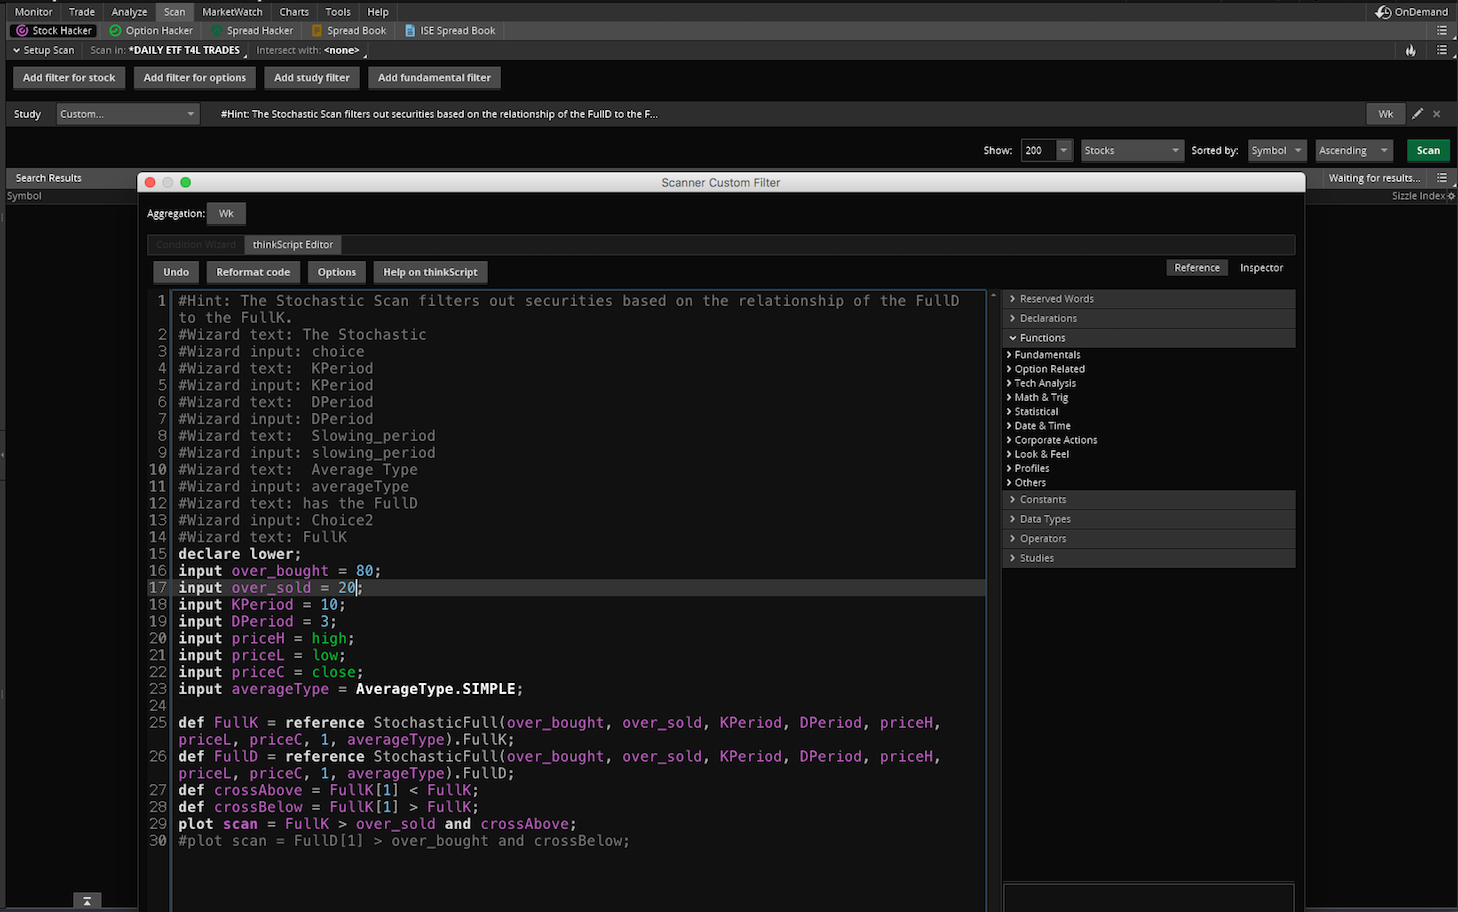
Hi Pete, I tried to make changes to one of the prior scans but it doesn’t seem to be working. I’m trying to create a dynamic alert for when the full stochastic %K (red) breaks up above 20% from the bottom on the weekly chart (attachment 1). The second attachment is what it looks like after I made the changes. Could you please advise on what I’m doing wrong? Thank you. Attachments:
Marked as spam
Answered on September 20, 2017 11:21 pm
|
|||
|
Private answer
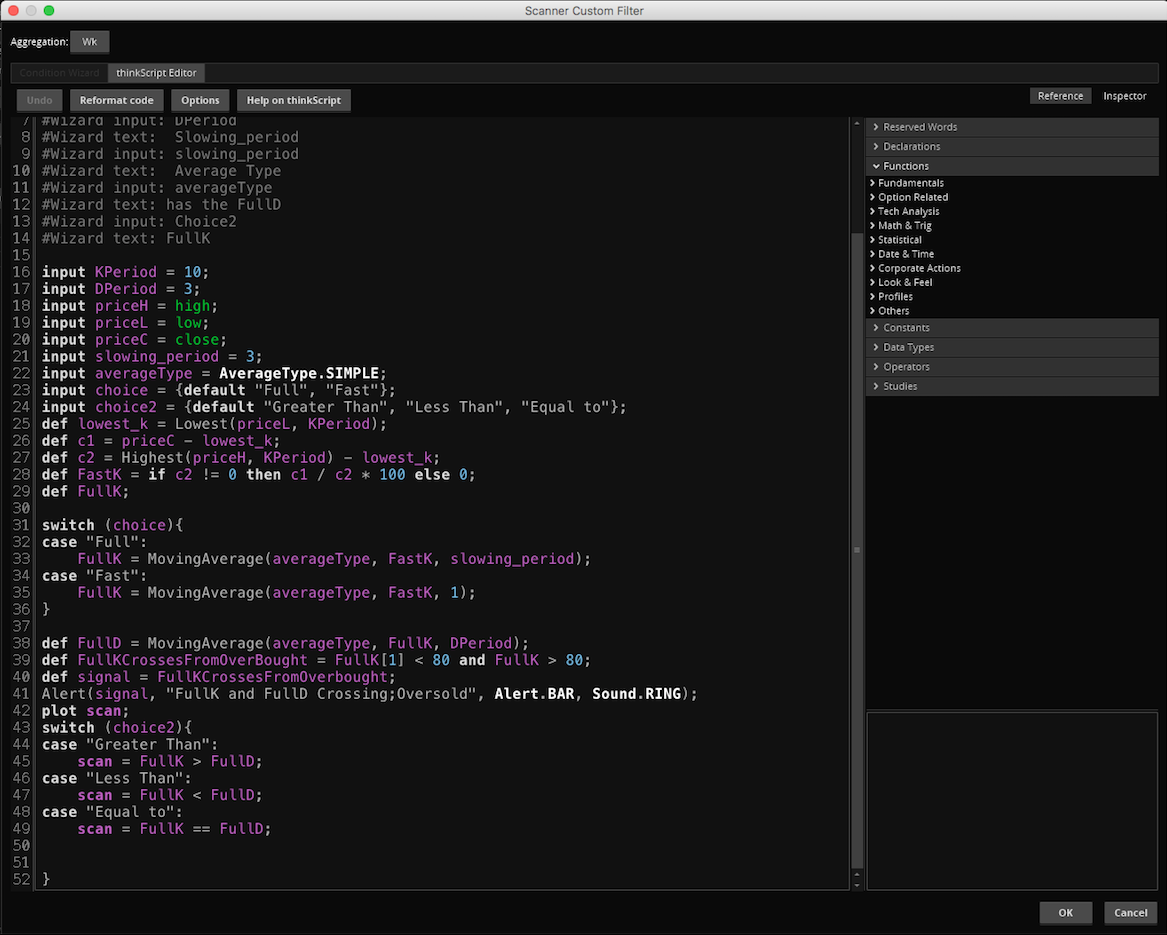
Based on additional information provided by R N on Sept 20th 2017. First thing is to mention the screenshot of the Stochastic lower study you provided. I mentioned in my first comment that study already included alerts. So we just copy that code and convert it to a scan. Before we do that, let’s explain why your attempt did not work. In your code, you are testing for the FullK crossing above the FullD and on the very same bar the FullK must cross above 20. In you screenshot you can see there are 2-3 bars between these two events. If you go back and check those other posts, there is a version which accounts for this: And it’s important to note this post was merely showing a modification of the code I demonstrated in the video titled “Thinkorswim Custom Scan Stochastic MACD”. Which you can view here: So all you really needed to do was to use the code provided with that video and drop the MACD portion from the signal. But for the sake of clarity and to show the conversion from chart study to scan I will provide the following:
How was this accomplished? Notice line number 10:
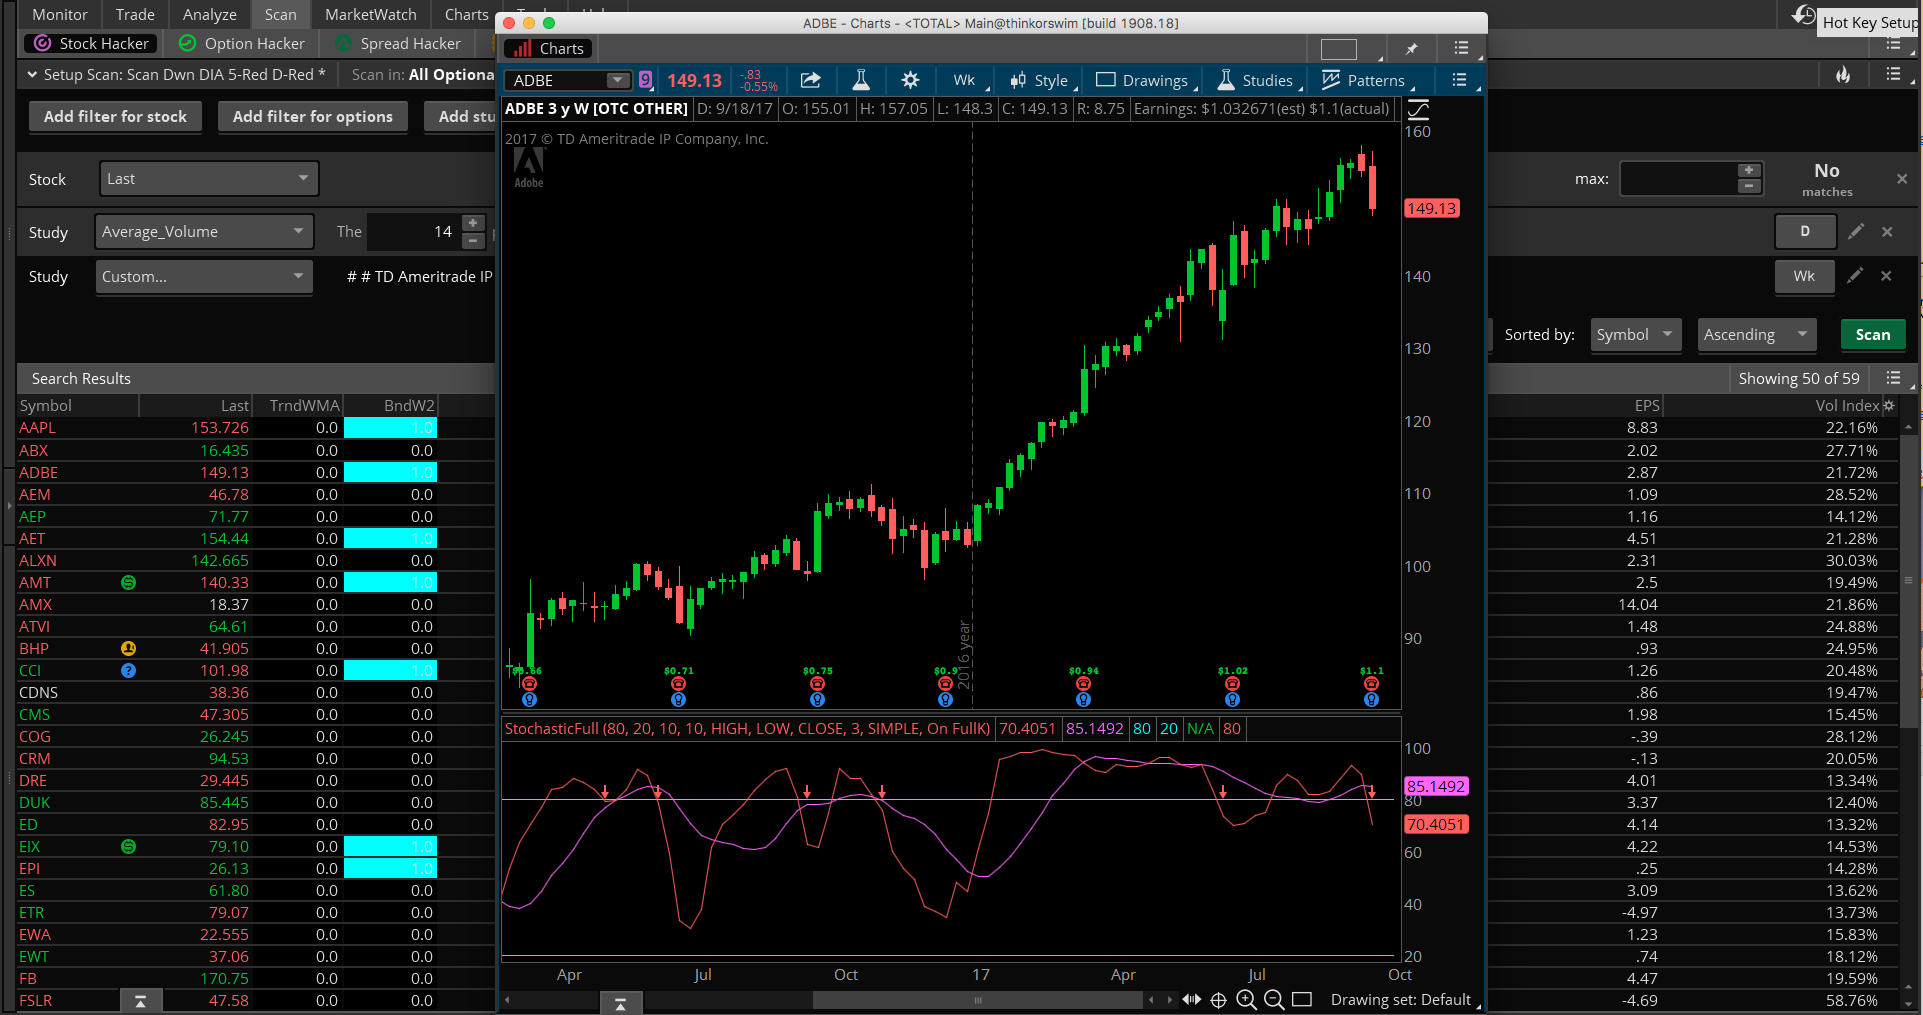
I moved the word “default” from in front of the “No” option to in front of the “On FullK” option. This turns on that type of alert for the chart based signal, from which this code was taken. The next step was to delete all the style statements at the bottom. Starting with After this we still had compiler errors telling us that only one plot was expected. So I found the several plot statements and replaced the word “plot” with “def”. Final step was to add our plot scan statements at the bottom. Attached screenshot shows the scan result for bearish signal along with a chart showing one of the stock in the results. Attachments:
Marked as spam
Answered on September 21, 2017 8:32 am
|
|||
|
Private answer
Thank you very much Pete! It works! Thank you! Marked as spam
Answered on September 21, 2017 4:28 pm
|
Please specify the type of alert you want to create. Alerts are included with the StochasticFull that is built into the platform. So you already have alerts at the chart study level. The other two forms are alert are called Study Alerts and Dynamic Alerts. Study Alerts are applied to a specific symbol. Dynamic Alerts are applied from within a saved Custom Scan and can be applied to a watchlist or public list.
The screenshot you provided indicates you were working on a custom scan. But I don’t want to presume to know what you want for the final result.
Hi Pete,
Thank you. I would like to create a dynamic alert so when the weekly stochastic %K comes from the bottom and breaks above 20% on any of the stocks in my watchlist, I receive an alert and also receive an alert when %k hits 80%. I would also like to create alerts when %k breaks below 80% (from above) and also when it hits 20%.
Thank you