Totally lost here. A single line of code from some other source does not provide anything to work with. Especially since you did not include a link to the original source. As far as measuring angles between elements on a chart. You will need to provide the mathematical formula. My math education stopped at algebra. I don't have the slightest clue what "Tan Theta" means. Sounds Greek to me, quite literally.
However I will tell you that angles do not exist on a chart. You can prove this yourself using a trendline and any chart. Draw a trend line and set its properties to display the label. Read the angle reported on the trendline and they click and drag the date range to zoom the chart in and out. You will find the angle changes based on the amount of zoom. (scans do not even have a date range you can manipulate)
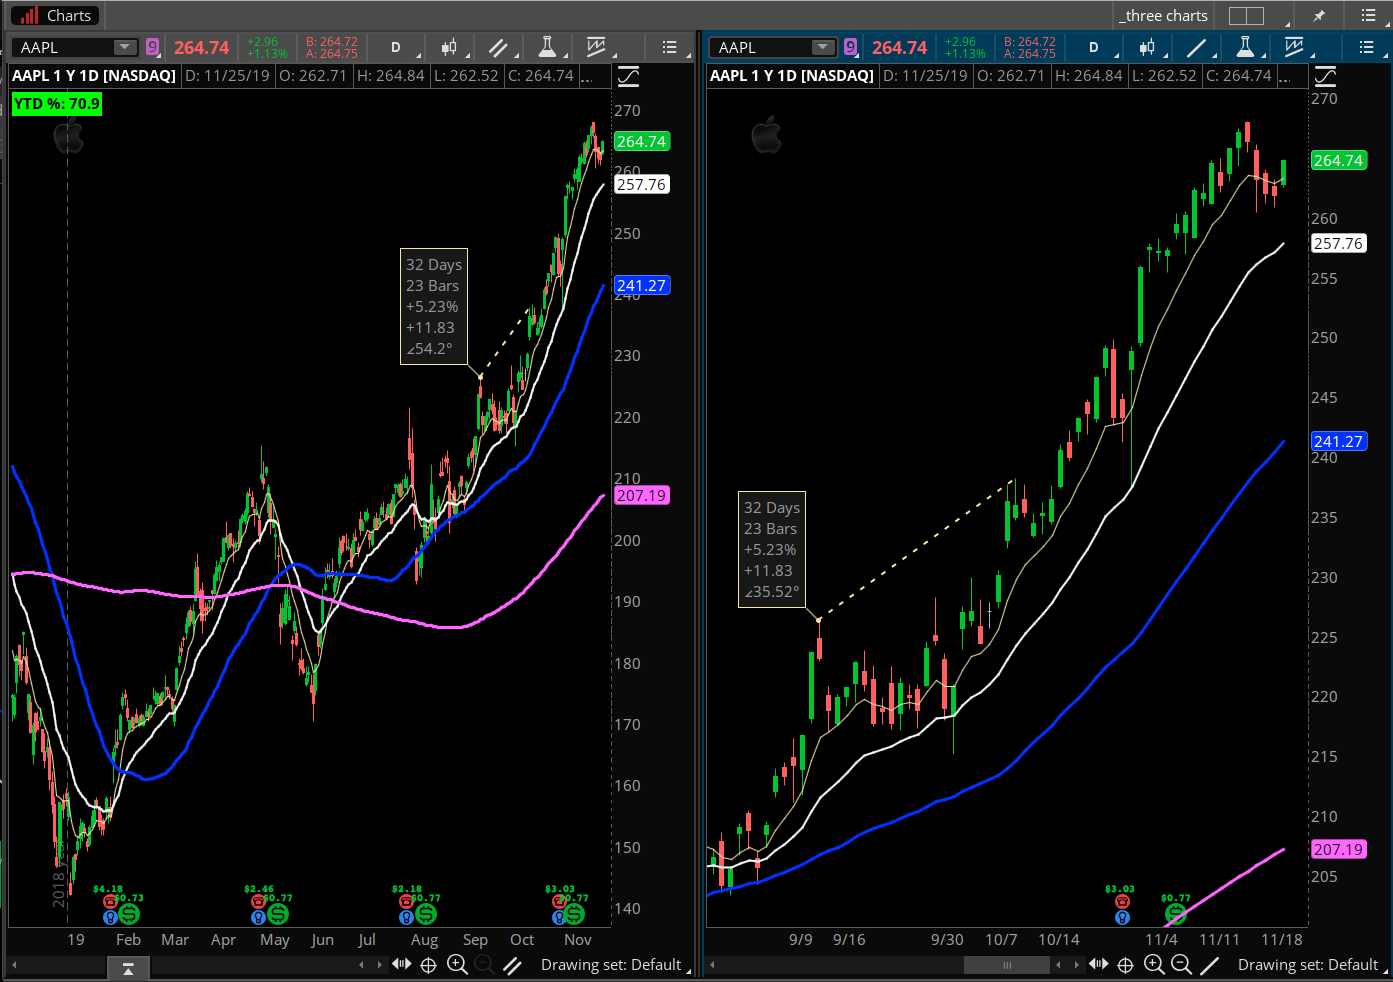
Check the screenshot below to see an example of this using the same trendline drawn on two charts. Both set to the same exact time frame with one of them zoomed in and the other zoomed out. The trendline reports 54.2 degrees on the left and 35.52 degrees on the right.
So, angles don't actually exist on a chart. The only thing you can measure is "rate of change". Price over time. Nothing more.