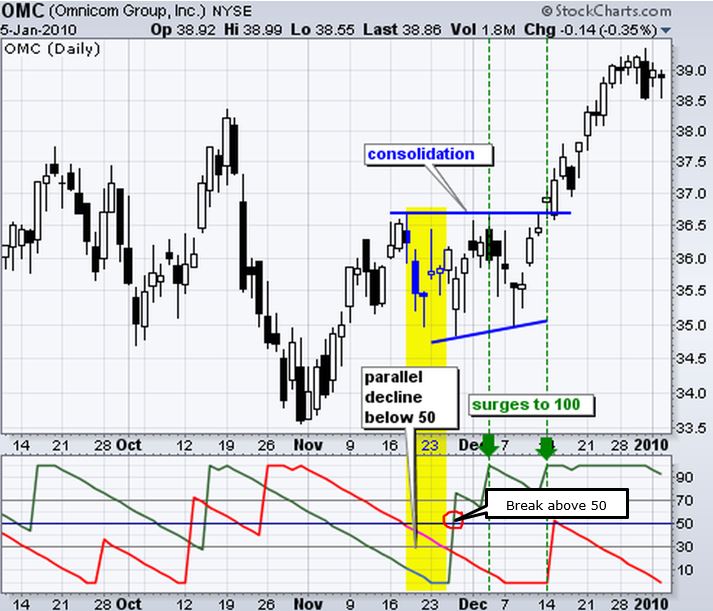
It's great that you provided a screenshot. However it's always best to provide one that includes current data so we can bring that chart up on our screens and take a look at the details.
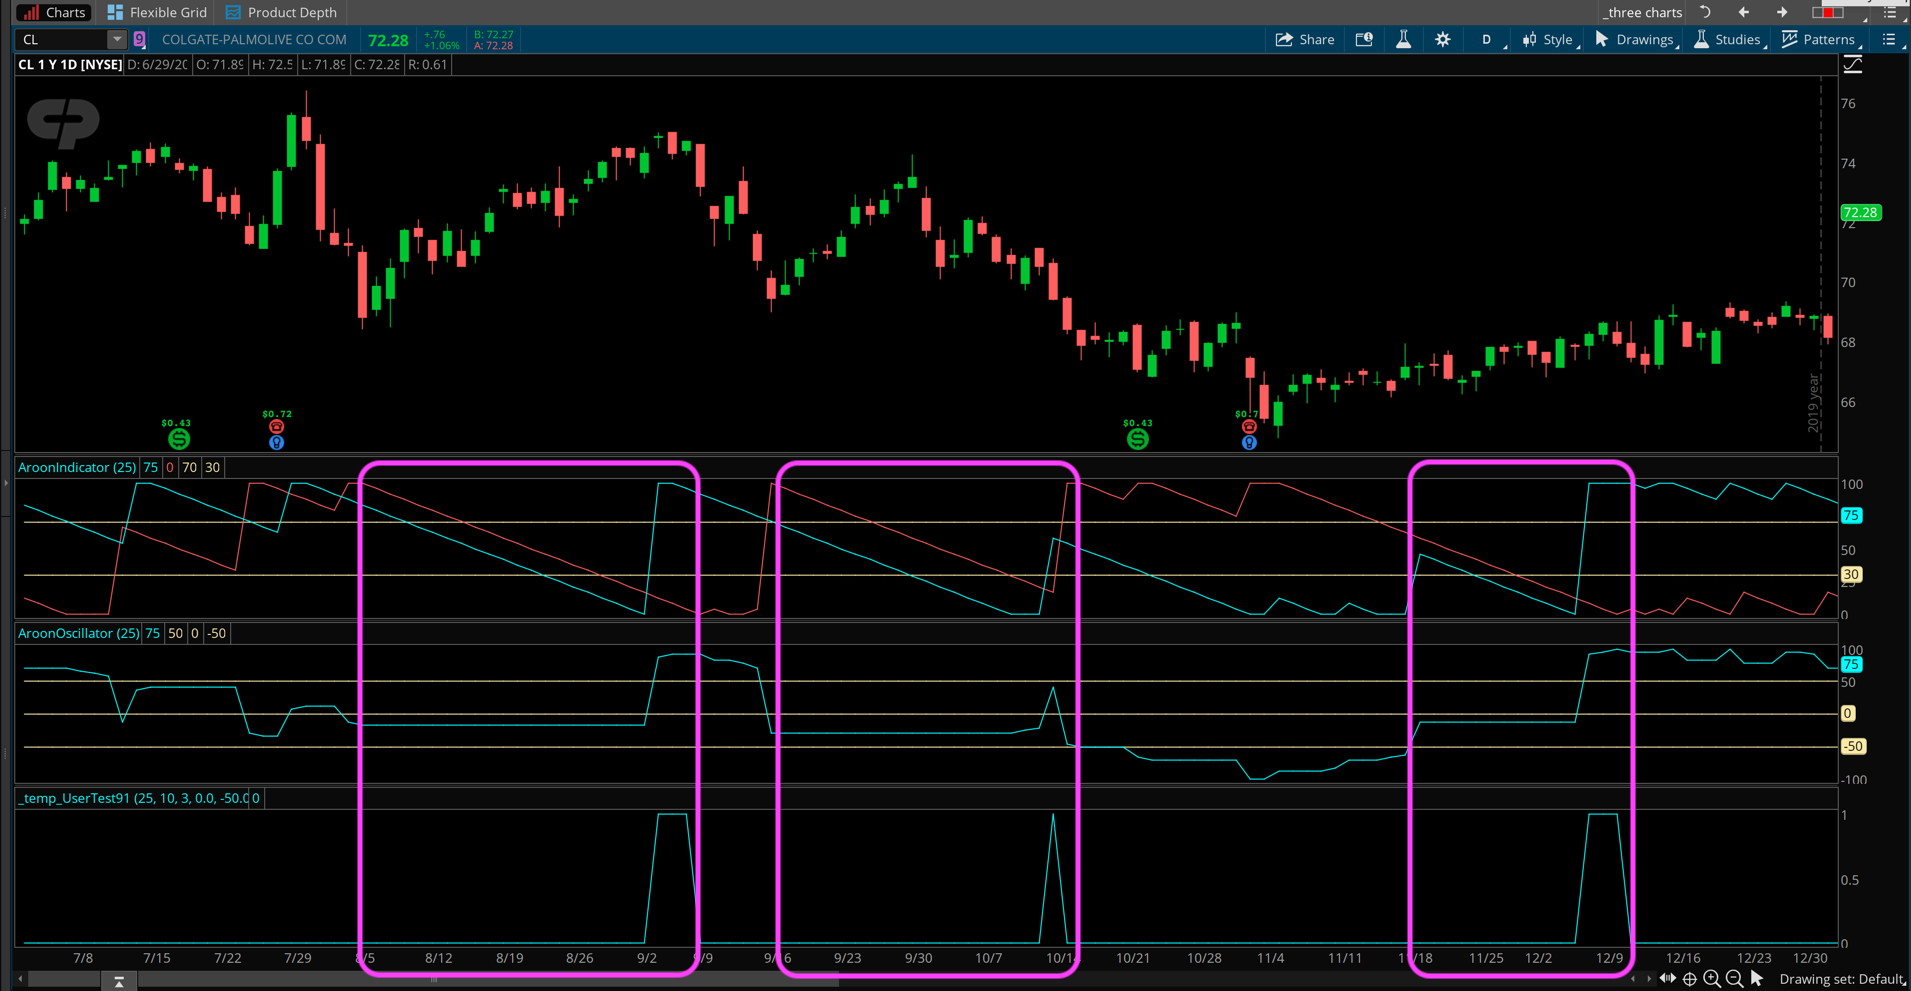
I added the Aroon indicator as well as the Aroon Oscillator to a chart and thumbed through a few charts to see if the oscillator somehow captured this challenging pattern in a way that is much easier to code. Screenshot below shows what I found. When the two line are parallel, they oscillator is flat. The closer that flat period is to the zero line the closer those two lines are to one another. So we have two metrics to work with and most of the hard work is down for us.
The code includes user inputs to adjust the key metrics without modifying the code. You will have to plan around with the settings to get the exact signals you are looking for. But the code is checking for a specified number of bars where the oscillator is flat. Then it checks if that flat pattern formed within the ideal range (below zero and above -50). When the oscillator breaks above the zero line the code checks if it was immediately preceded by this flat pattern formation.
Here is the code:
input length = 25;

input barsToBeFlat = 10;

input barsToTrigger = 3;

input flatRangeHigh = 0.0;

input flatRangeLow = -50.0;

Assert(length > 0, "'length' must be positive: " + length);

def aroonUp = reference AroonIndicator(length = length).Up;

def aroonDown = reference AroonIndicator(length = length).Down;

def upDownDiff = aroonUp - aroonDown;

def twoBarDiff = upDownDiff - upDownDiff[1];

def flat = twoBarDiff == 0;

def desiredPattern = Sum(twoBarDiff, barsToBeFlat) == 0 and upDownDiff < flatRangeHigh and upDownDiff > flatRangeLow;

plot scan = Highest(desiredPattern[1], 3) > 0 and upDownDiff > flatRangeHigh;
I recommend you plot this on a lower chart study as shown in the screenshot below. This will help you play around with the settings to get things dialed in exactly as you require. Then you can use those settings for your scans and further tweaks things using the scan results as feedback.