| ♥ 0 |
Hi Pete. First of all thank you for all you’re teaching and showing us how to become familiar with the ThinkorSwim platform, you’re Awesome.
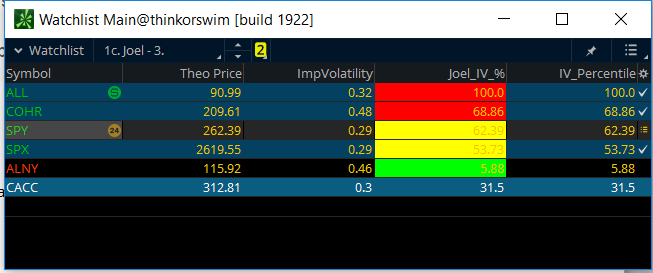
I’m able to create 3 background colors for IV_Percentile showing the following criteria in the watch list column; >68 = RED, <32 GREEN, otherwise YELLOW. AssignBackgroundColor(if (data – lo)*100 / (hi – lo) > 68 then Color.RED else if (data – lo)*100 / (hi – lo) < 32 then Color.GREEN else Color.YELLOW);
I’m stuck trying to assign this criteria to the number that are displayed, instead of having the background highlight those colors. AssignPriceColor(if (data – lo)*100 / (hi – lo) > 68 then Color.RED else if (data – lo)*100 / (hi – lo) < 32 then Color.GREEN else Color.YELLOW); def IV = impVolatility(); rec data = if !isNaN(IV) then IV else data[1]; def hi = highest(data,252); def lo = lowest(data,252); plot perct = (data – lo)*100 / (hi – lo);
I added the following script below to ThinkorSwim IV_Percentile default script; AssignBackgroundColor(if (data – lo)*100 / (hi – lo) > 68 then Color.RED else if (data – lo)*100 / (hi – lo) < 32 then Color.GREEN else Color.YELLOW); Attachments:
RESOLVED
Marked as spam
Asked on February 11, 2018 12:07 pm
310 views
|
|
Private answer
I don’t have access to a computer at the moment. But perhaps I can steer you to the solution. The values displayed in a watchlist column come from the plot statement. Your plot is named “perct”. You will set the color of that plot using this statement:
Placing your logic for the color selection within the parenthesis. If you want to see a great example of this be sure to view this video: https://www.hahn-tech.com/thinkorswim-adx-dmi-watchlist/
Marked as spam
Answered on February 11, 2018 3:04 pm
|
|
|
Private answer
Made the changes as you recommended, worked perfectly. Thanks again for all you do to help us out. Marked as spam
Answered on February 11, 2018 5:34 pm
|