Automated Lines using VolumeRateofChange


Category:
0
1

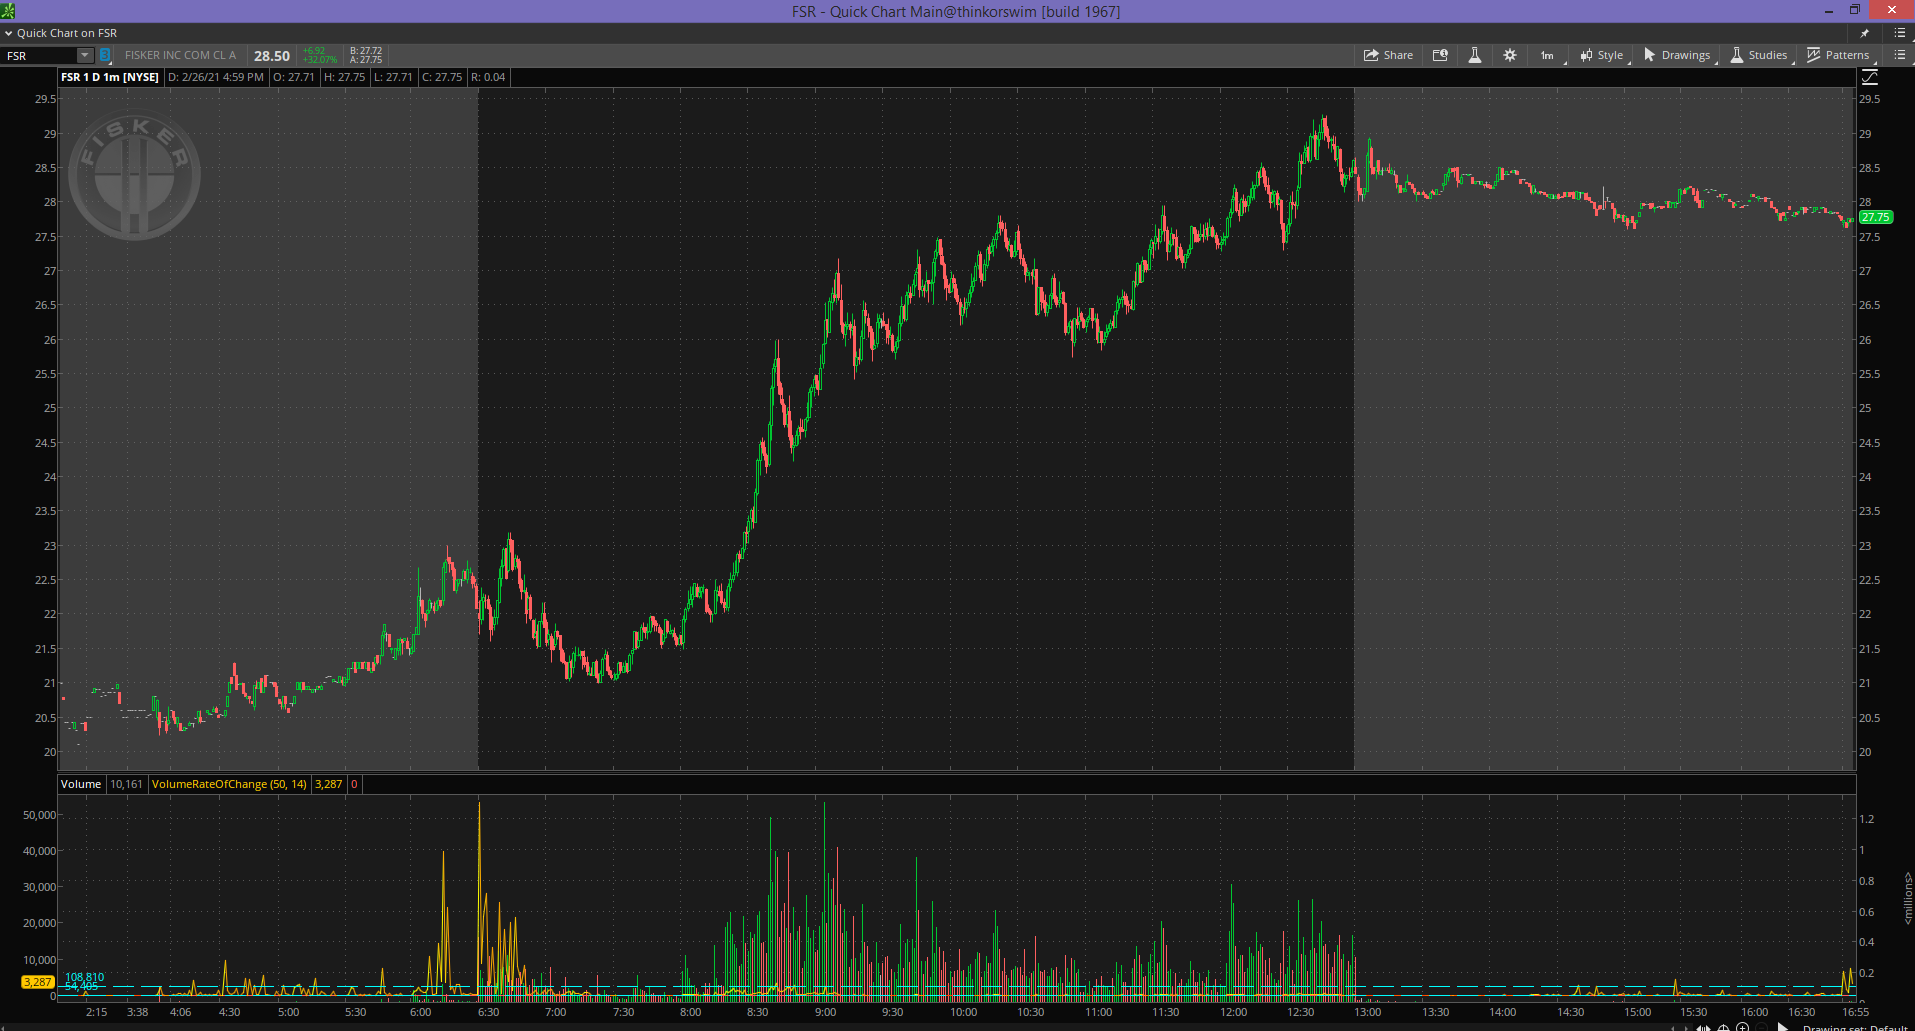
I’m requesting an automated horizontal lines drawn on lower chart volume using VolumeRateofChange indicator.  One line is the total volume on a 1day 1min chart from VolROC highest.  The 2nd line is multiplied by 2 from the first line.  “Length” is changed to 50 from default 14 .
*first line is the total from highest color (yellow).  2nd line is multiplied by 2

full chart attached for ticker FSR.  Thanks Pete

Attachments:
RESOLVED
Marked as spam
Posted by (Questions: 12, Answers: 4)
Asked on February 27, 2021 9:49 pm
117 views
0
Private answer

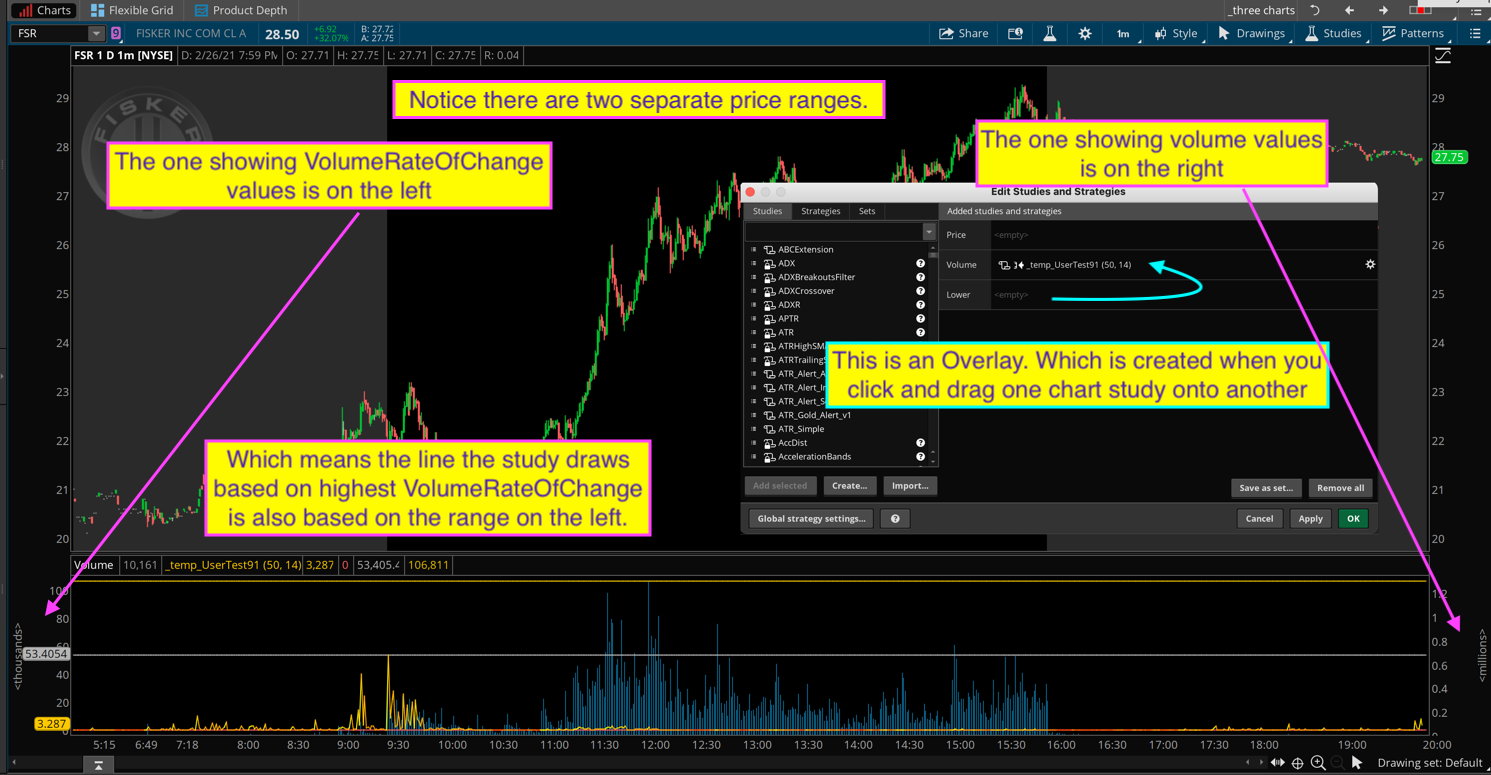
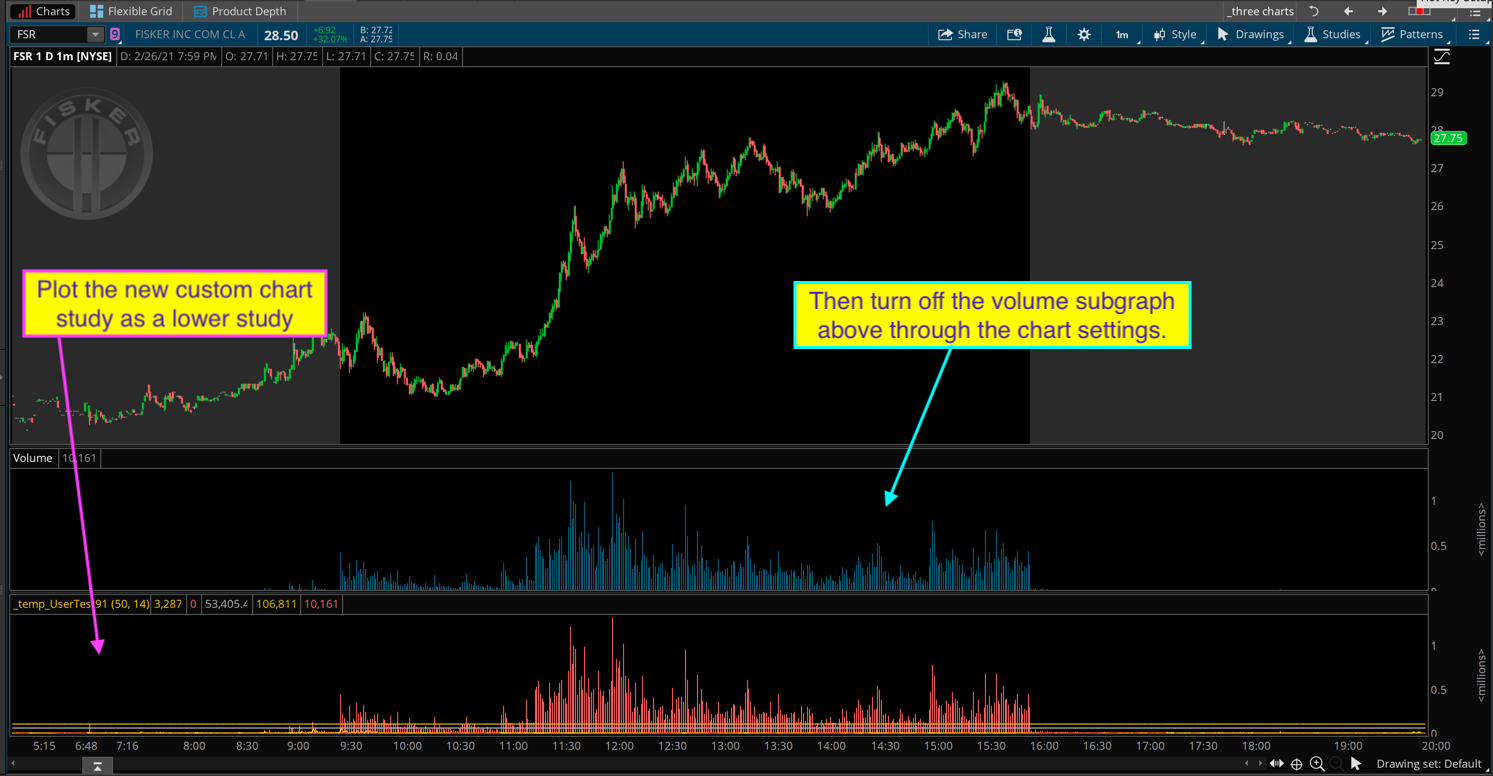
What you have created there is called an Overlay. This creates an optical illusion on the chart because each plot is based on a separate range. (one range on the left and another range on the right). Each plot in your screenshot is complete separate from the other. You cannot make any reasonable comparison between these two plots because they come from completely different universes (ranges).

You can get a full explanation about overlays and what dangers they pose in the following post on our forum:

https://www.hahn-tech.com/ans/overlay-one-study-onto-another-for-crossover-signals/

This means that we cannot create a chart study using the method you used on your chart. The first screenshot below explains what you did to create this and why it is not possible to complete this using the overlay method. (notice the two lines are no where near where you have expected them to fall)

The second screenshot shows how to apply a self contained custom chart study to accomplish this goal. Notice that this gets plotted independently as a stand lone chart study. Then you turn off the volume subgraph through chart settings.

Here is the code to use for the second screenshot:

declare lower;
input length = 50;
input colorNormLength = 14;
assert(length > 0, "'length' must be positive: " + length);
plot VolROC = if volume[length] <> 0 then (volume / volume[length] - 1) * 100 else 0;
plot ZeroLine = 0;
VolROC.DefineColor("Highest", Color.YELLOW);
VolROC.DefineColor("Lowest", Color.LIGHT_RED);
VolROC.AssignNormGradientColor(colorNormLength, VolROC.color("Lowest"), VolROC.color("Highest"));
ZeroLine.SetDefaultColor(GetColor(5));
def lastDay = GetDay() == GetLastDay();
plot highestVolRoc = HighestAll(if lastDay then VolROC else 0);
plot lineTwo = highestVolRoc * 2;
plot data = volume;
data.SetPaintingStrategy(PaintingStrategy.HISTOGRAM);
data.SetLineWeight(3);


Attachments:
Marked as spam
Posted by (Questions: 37, Answers: 4084)
Answered on February 28, 2021 9:31 am
0
thanks Pete it works fine for current day but I need it to calculate previous day as well in case VROC is at its highest point on the day prior. Thanks so much
( at February 28, 2021 7:53 pm)
0
You can try changing def lastDay = GetDay() == GetLastDay(); to def lastDay = yes; But that is likely to produce unpredictable results. This is as far as I can take this in the Q&A Forum. I have already exceeded the amount of time I allow for free solutions in the forum.
( at February 28, 2021 9:19 pm)
0
Thanks for your time Pete!
( at February 28, 2021 9:26 pm)
0
Pete, I am a little bit confused. Looking at the volume (blue) vs temp ( orange), they look identical to me. What purpose does this serve, I am missing something.
( at July 17, 2021 7:04 am)
0
The bottom subgraph, (orange), includes volume as well as a second indicator called VolumeRateOfChange. The top subgraph, (blue), includes only the volume.
( at July 17, 2021 7:54 am)