Automatic Fibonacci Time Series Plot


Category:
0
0

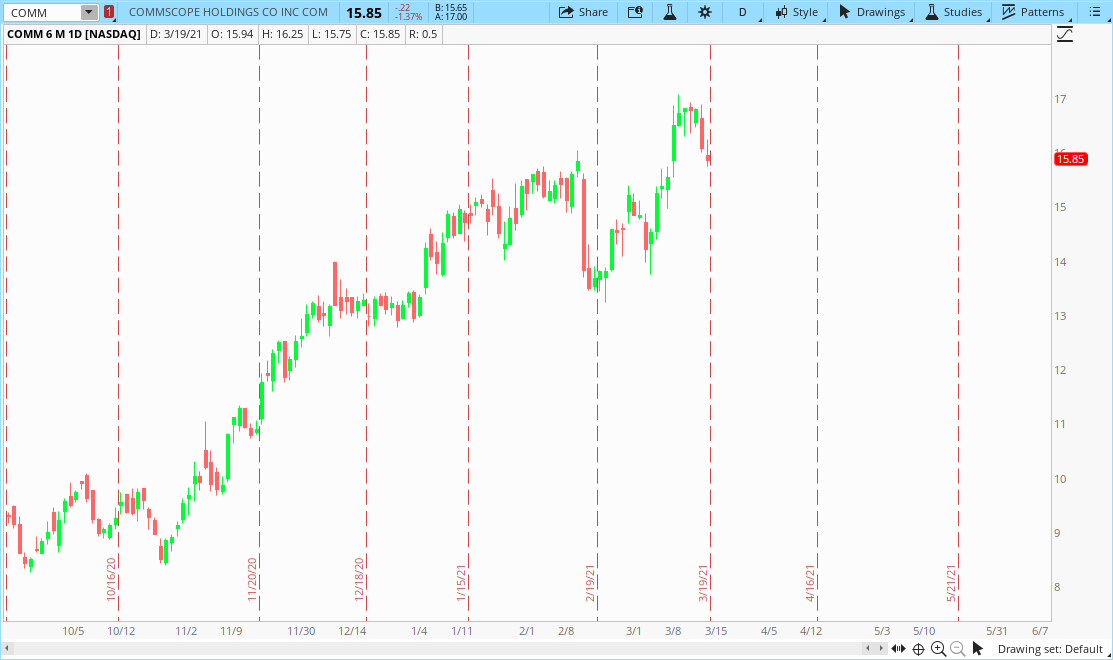
Hello Hahn! I am planning to have an automatic fibonacci time series plot which can be same as the pivot point formula but for the time axis (x axis). Hopefully it will look like the rollover fridays plot.

Attachments:
Marked as spam
Posted by (Questions: 5, Answers: 6)
Asked on March 20, 2021 7:03 am
135 views
0
Private answer
  1. Totally impossible create something like this for Thinkorswim
  2. The Fibonacci time series begins at a single point at the far left of the chart and extends to the right, indefinitely.
  3. This requires the use of a trading platform language which includes custom sized arrays, standard looping functionality and the ability to create and modify drawing objects.
  4. For any platform language that would support this, the solution would be extremely complex and VERY expensive.
Marked as spam
Posted by (Questions: 37, Answers: 4087)
Answered on March 20, 2021 8:42 am