| ♥ 0 |
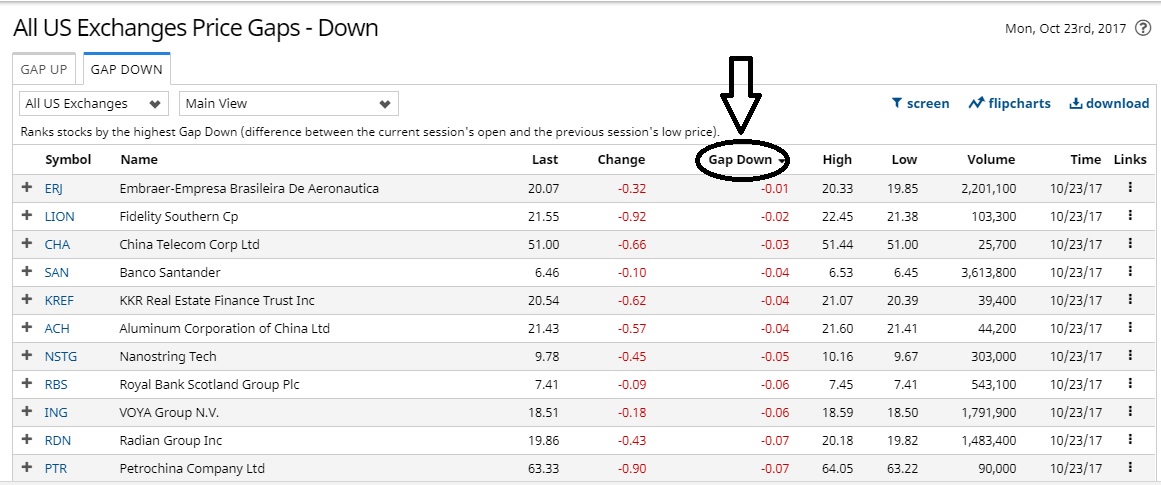
Hi Pete! I’m trying to run a Gap down scan on TOS with the same format that Barchart offers. I know that i can find the gap downs on TOS but i’m trying to find the size of the gap and can’t seem to find it when i run it on TOS. Can you please help? Thank you 🙂 Attachments:
Marked as spam
Asked on October 23, 2017 8:19 pm
1768 views
|
|
Private answer
Well we would need to know how the gap down is measured by Barchart.com in order to get an exact match. The other point to make is this solution would need to be implemented in a custom column of a watchlist. Since you don’t what to scan for a value but rather display it. So we’ll need to move this post out of the Stock Scanners topic and into the Watchlists topic. The solution should be very simple. Add a custom column to a watchlist set to daily time frame. Then add this code in the editor:
This single line of code will compute the difference between today’s close and yesterday’s close, when applied to a daily time frame. If there is a gap up, the value will be positive. Negative for gaps down. However I believe there is a bit more to this. Do you know exactly how Barchart.com computes their gap value? One might consider using the previous day’s high and the current day’s low for a gap up. Then use previous day’s low and current day’s high for a gap down. Let us know if you can provide more information so we can dial this in further. Marked as spam
Answered on October 23, 2017 10:10 pm
|
|||||
|
Private answer
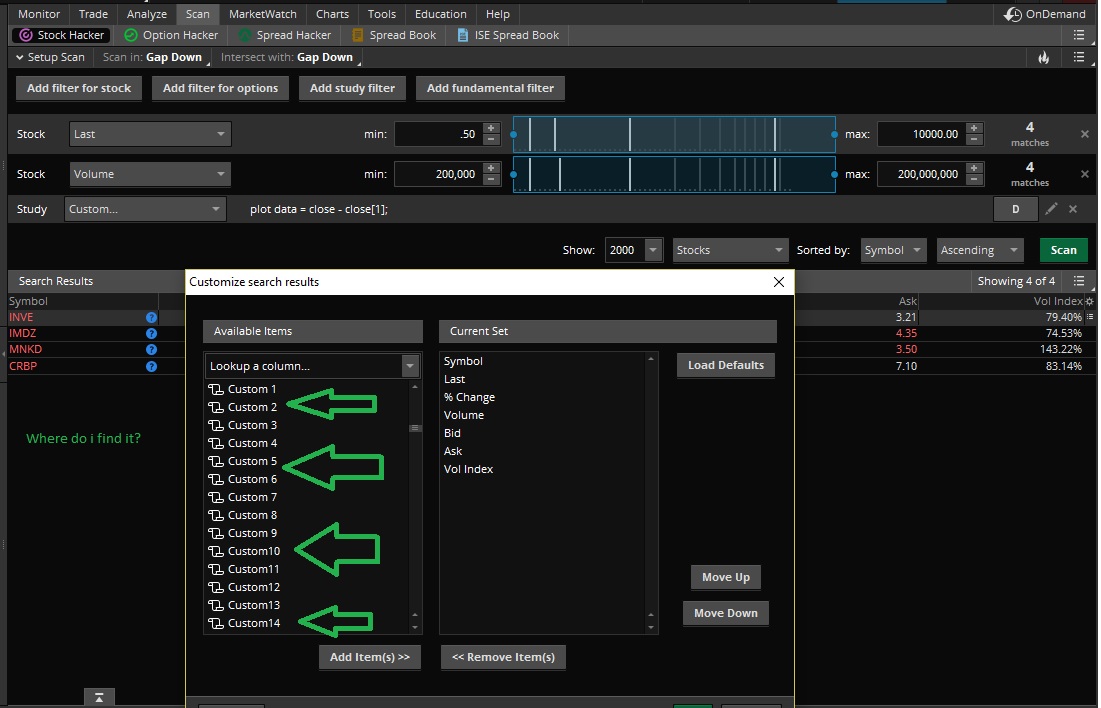
hi, this is great. Ok, so i’ve added it to my scan but i don’t know where to find it since i can’t name my “custom study” so when i click on the customize, i get a list but i don’t know where to find it to add it. I tried to name the custom and couldn’t so i’m thinking that i’m doing something wrong. Can you please help. Attachments:
Marked as spam
Answered on October 24, 2017 8:23 am
|
|||||
|
Private answer
by the way Barchart.com takes the difference between the current session’s open and the previous session’s low price Marked as spam
Answered on October 24, 2017 8:27 am
|
|||||
|
Private answer
In response to additional information provided by Adrianna on Oct 24th I have assembled some screenshots to show the basic steps for setting this up. Before proceeding make sure you have watched the following video: https://www.hahn-tech.com/thinkorswim-custom-watch-list-columns/ These are the steps required:
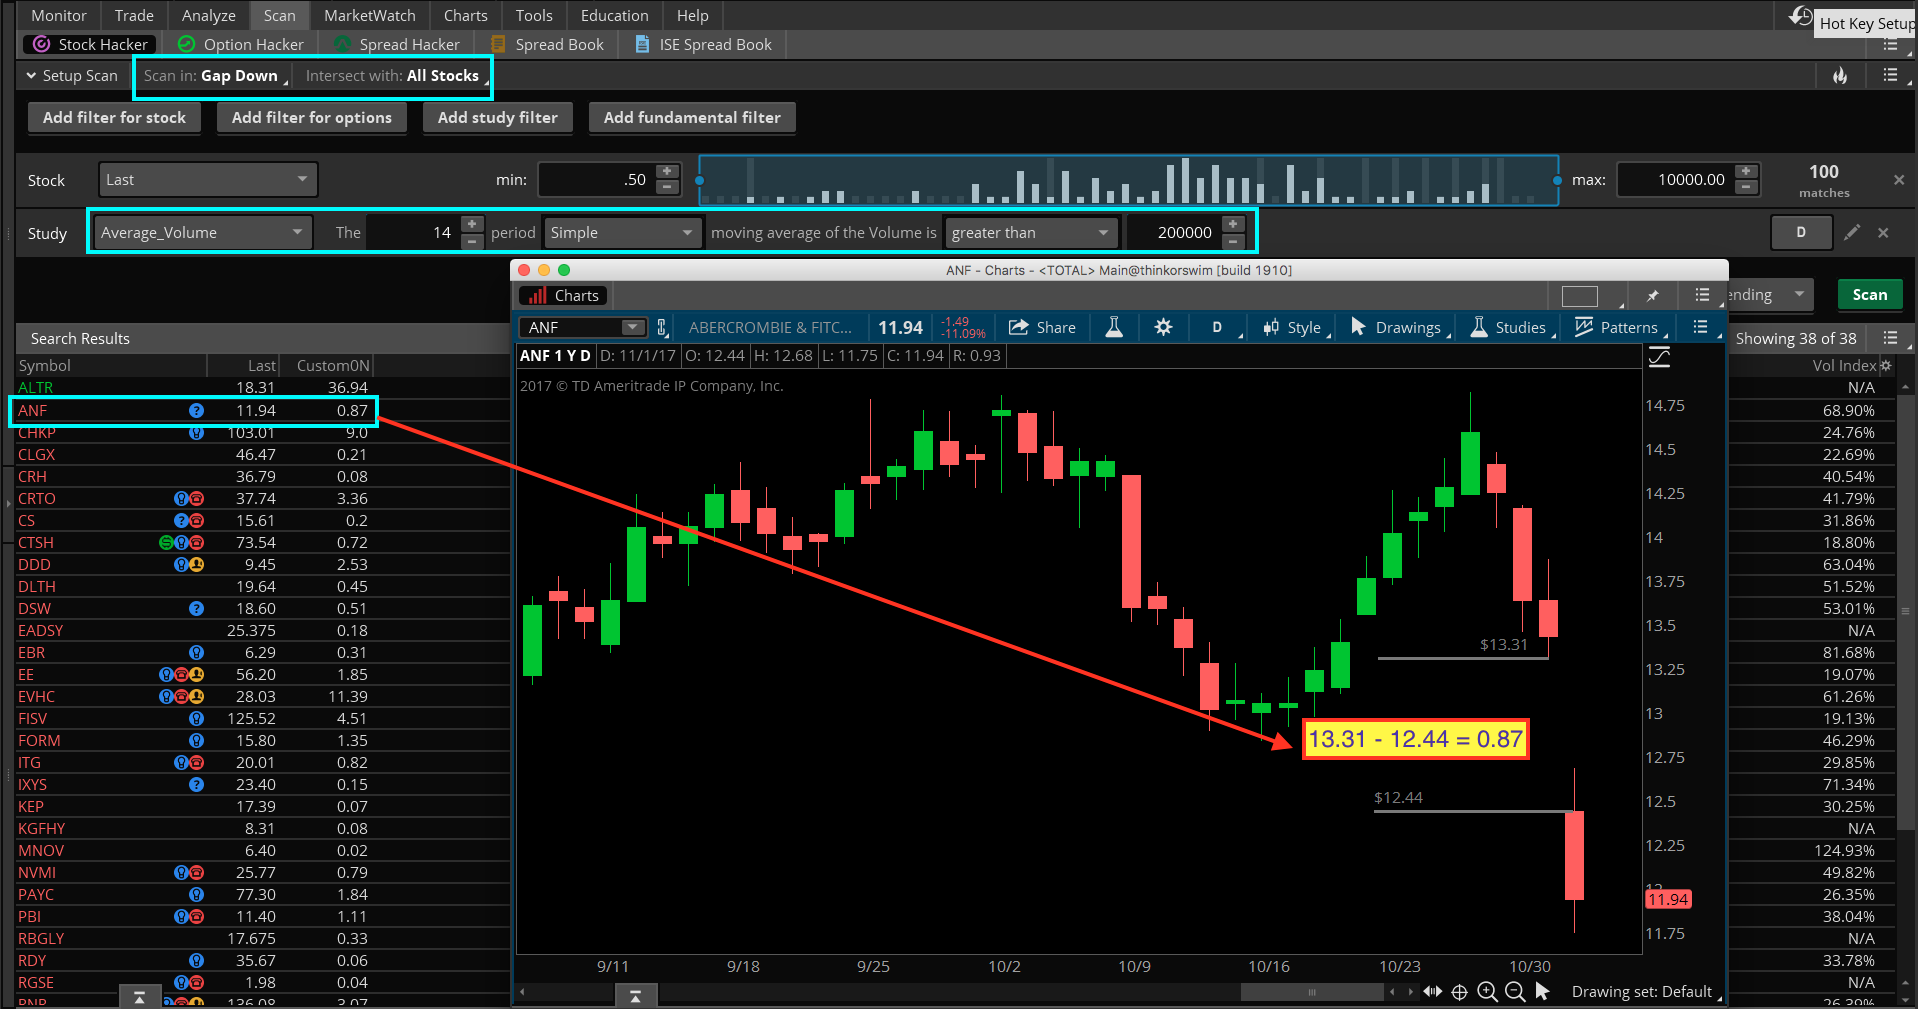
The last screenshot shows a chart of ANF indicating the gap size calculation. Attachments:
Marked as spam
Answered on November 1, 2017 3:32 pm
|
Hi, i’m willing to pay you for the code. I just need one ASAP. I’m using barchart.com to find my gaps but i would like to find more on TOS. Barchart measures its gaps by taking the difference between the current session’s open and the previous session’s low price.
Sorry for missing your response on Oct 24th. I would have responded to that right away had I seen it. The screenshot you provided shows that you are modifying custom columns in the results section of the scan screen. If you want to know how to rename those I encourage you to watch our videos in the Watchlist category: https://www.hahn-tech.com/category/tos/watchlists-tos/
Just pick a few of them and you will quickly learn how to build those correctly.
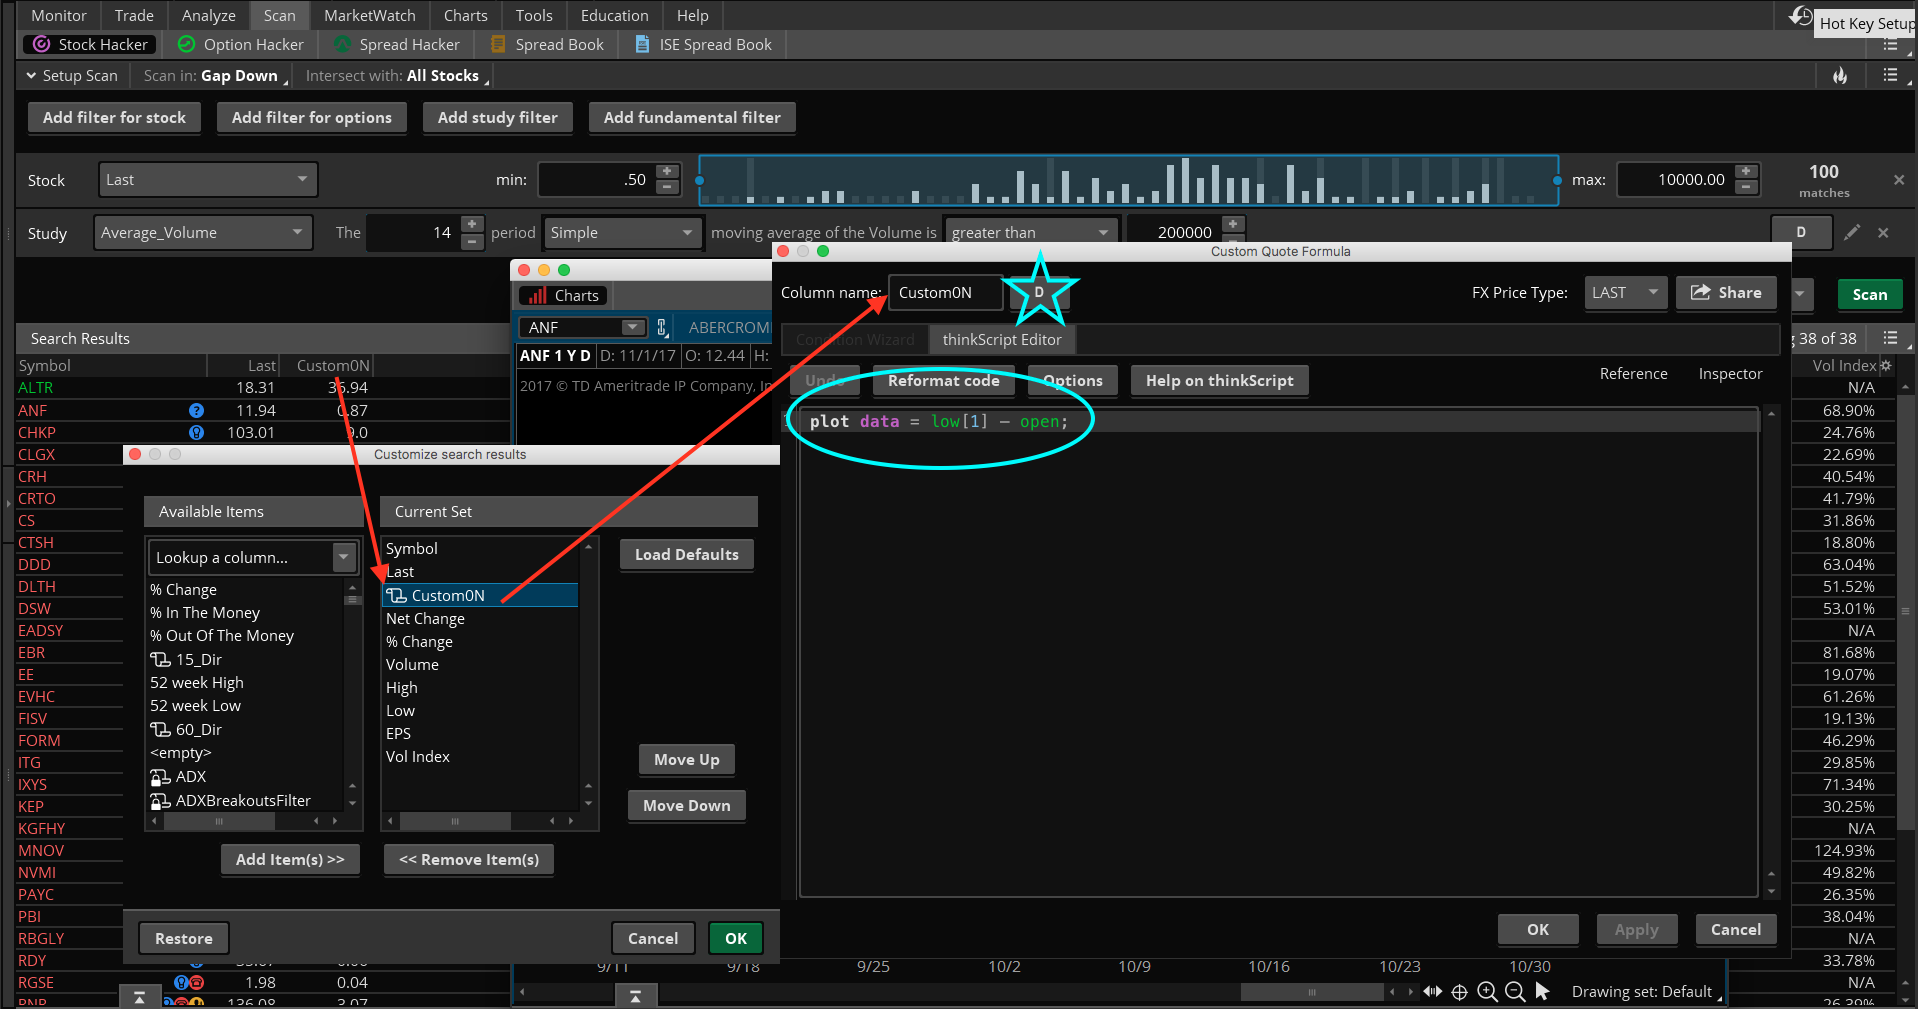
The code for previous day’s low and current day’s open is:
plot data = low[1] – open;
Applied to a daily time frame, this will be the same as “Previous day low minus today’s open”. Positive values indicate the size of the gap down. Negative values would be no gap, or a gap in the other direction.