| ♥ 0 |
Hahn, I have learned bundles of information from your website. I genuinely appreciate all that you do! I am having a lot of trouble figuring this study out though.
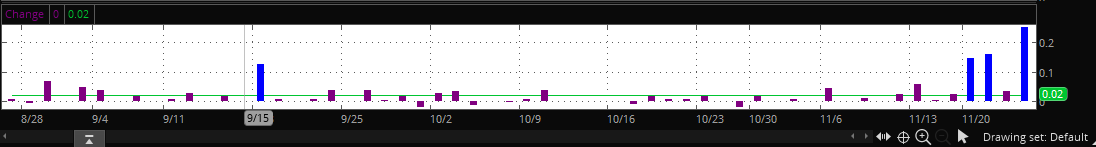
In the screenshot below, there are blue bars and purple bars. For this example, lets say there are a total of 64 bars. I need the study to calculate what % of the time does a blue bar pop up? Also, for this example we can say that a blue bar appears when close > close[1] and a purple bar appears when close < close[1].
Thank you very much! Attachments:
Marked as spam
Asked on November 25, 2017 4:53 pm
92 views
|
Very simple math, so the solution should be quite simple to implement. We do need to define the scope of the time variable though. What percent of the time…. We can simply count every single bar on the chart, then divide the number of blue bars by the number of all bars. But do you need this calculation to span a specific amount of time?
This is for a 3 month chart, each bar represents one day. I am confused on what to put in the “x” down below
The 64 represents the 64 days in the 3 month chart. This is just for an example.
def percentoftime = (x/64)*100;
I don’t know how to make the study count how many times there is a blue bar, that’s the problem. Thank you!