| ♥ 0 |
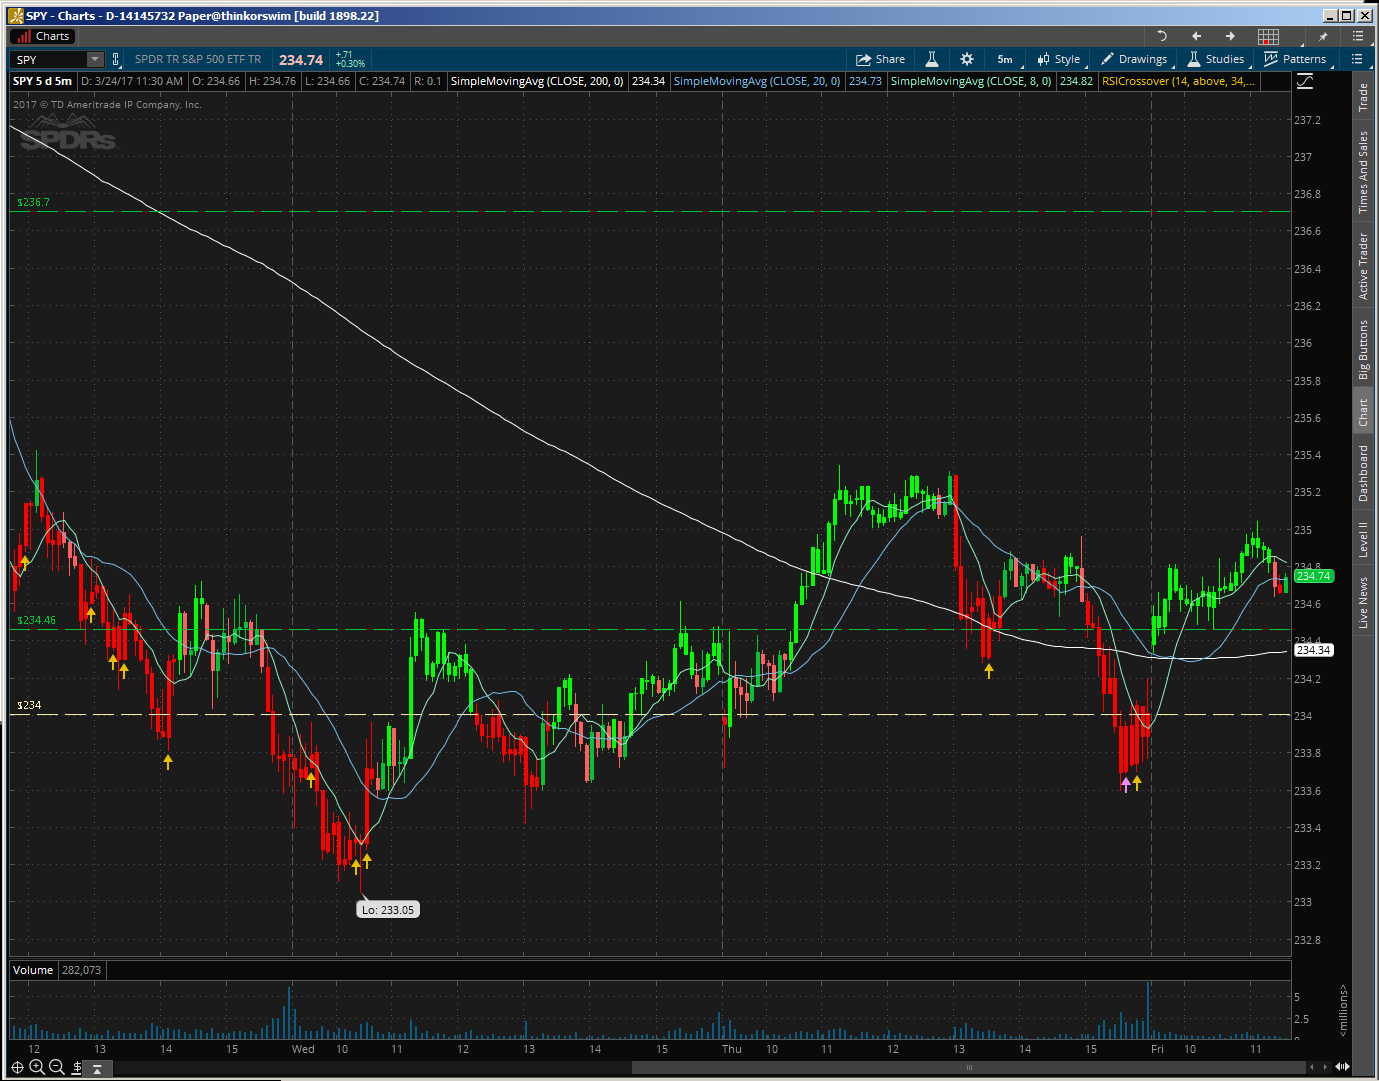
Hey traders. so I wanted to make this study where the bars are colored in GREEN above the 20sma, and colored in RED below the 20sma. So I contacted thinkorswim customer service and the guy told me that I could use this study LBR_PaintBars and so i configured the inputs for // hl length=20 // atr length=9 // factor=2,5 // and it kinda worked but I was wondering if any of you guys know another way to do this with more precision, because as you can see in the image below, through this LBR approach we got some candles that was not painted And some that were painted outside the specified conditions And also how I could config TOS to give me alerts, whenever the monitored stock changes from below the 20sma to above, and from above to below as well. Preferably on the 5min chart Cheers Attachments:
RESOLVED
Marked as spam
Asked on March 26, 2017 11:35 am
3467 views
|
|
Private answer
I see that we have a two part question. I’ll begin by addressing part 1. In order to dynamically adjust the color of the candles we use a function called AssignPriceColor(). You can read more about that here: http://toslc.thinkorswim.com/center/reference/thinkScript/Functions/Look---Feel/AssignPriceColor.html The function takes a single argument, Color. We will use an if/then statement to set the color based on the position of the close in relation to the simple moving average.
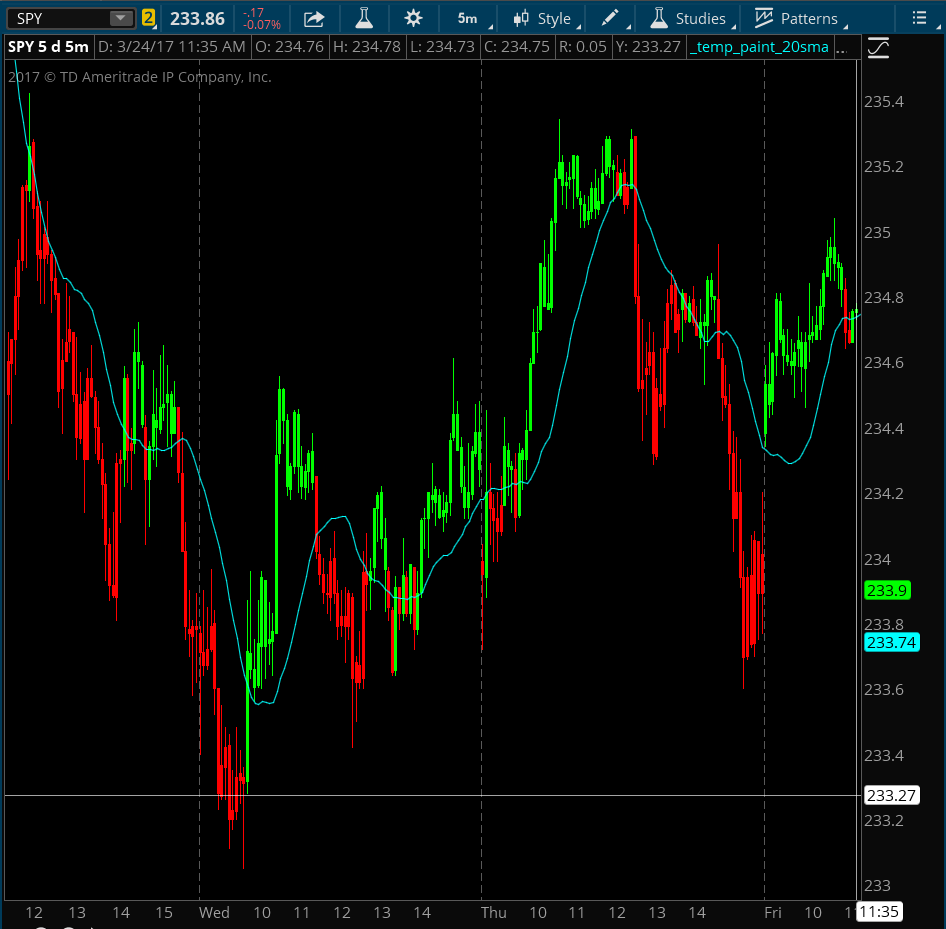
That’s it. Nothing more is needed. Now on to the second part of the question. The request is for an alert that will trigger whenever the color changes from one color to the other. In this case we will add a function called Alert(). You can read more about that here: http://toslc.thinkorswim.com/center/reference/thinkScript/Functions/Others/Alert.html Before we add this, we’ll need to define the conditions. We’ll do this using a statement that will check if the previous bar is below the sma, while the current bar is above it. Then we’ll do the reverse to capture the other change. Then we’ll use these two conditions as the trigger for each of two alerts. So we’ll be adding these four additional lines to the two original lines shown above.
And we’re done. Screenshot below shows the results. Be sure to up-vote any answers that best solve your question! Attachments:
Marked as spam
Answered on March 26, 2017 12:29 pm
|
|||||||
|
Private answer
In response to the second question about adding alerts based on two conditions. It is always easiest to begin with the full list of specifications and write the code using all the facts. The reason is that very often the additional specifications cause us to disregard lines of code that were previously written. You cannot simply combine two sets of conditions without regard for how they interact on the chart. Case in point. For your set of rules, you did not specify if the close above the SMA should always occur before the color change in the SMA. Or perhaps the SMA should change color first, followed by the close above the SMA. So you can’t just take a cross of the SMA and use that in combination with the change in color of the SMA. You have to take them both into consideration and write the code so that both events are properly accounted for. Unless you only want one of them accounted for. This code provides for both events occurring.
Marked as spam
Answered on March 29, 2017 10:17 am
|
|||||||
|
Private answer
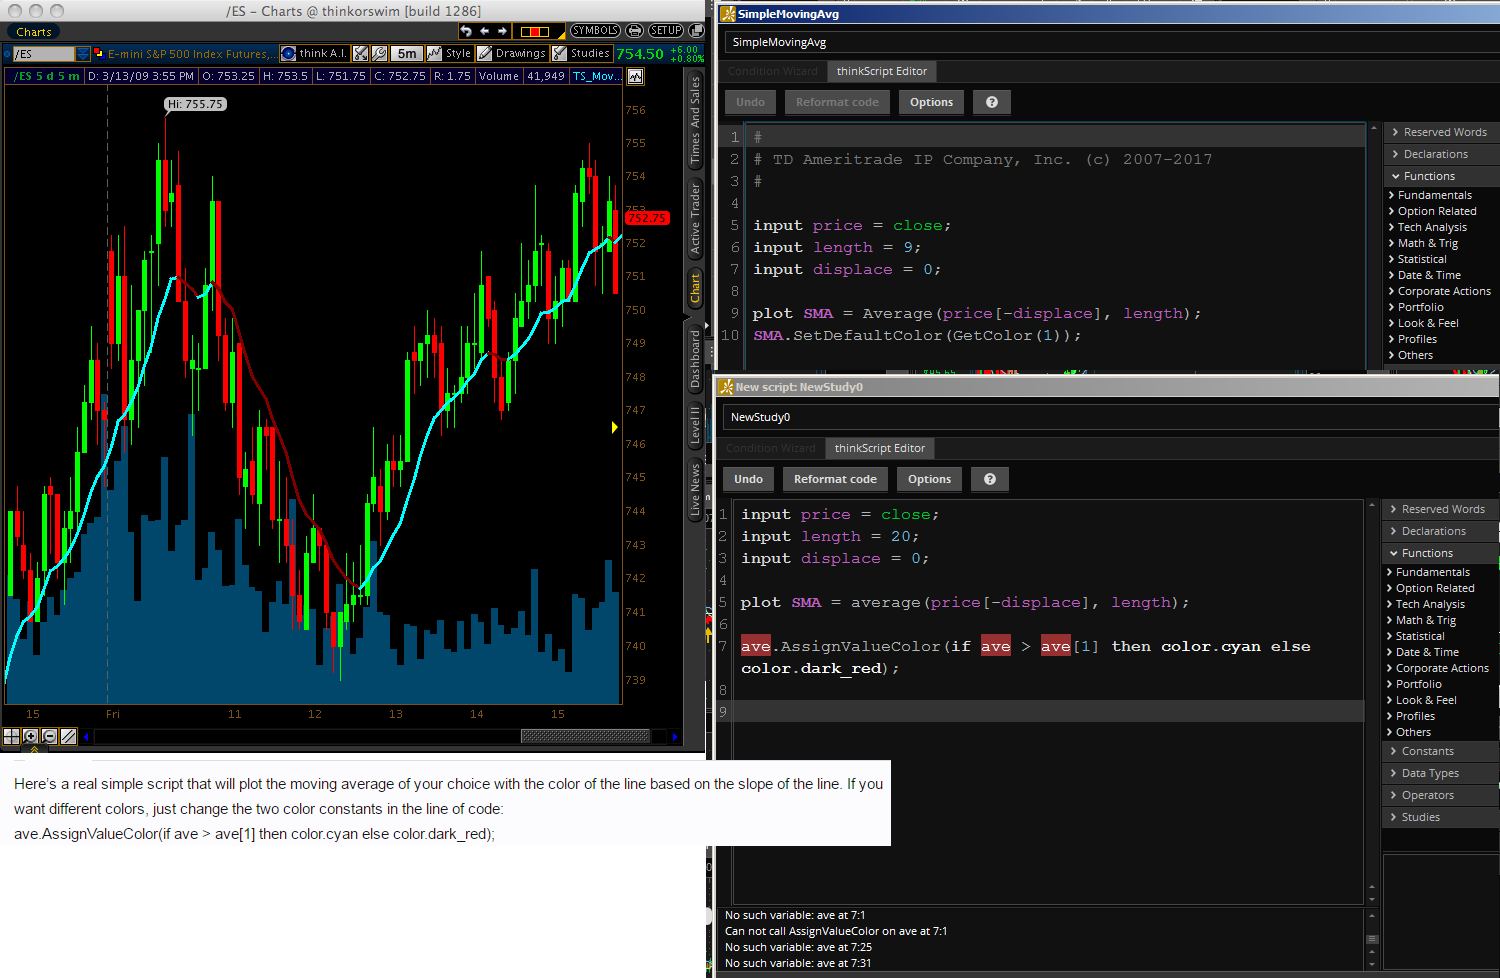
Nice answer Pete ! Like this image below. The problem is that I tried to config this on TOS and gave this problem “no such variable: ave” Do you see where I’m going with this? After that, the final scanner will alert me when the moving average is directed upwards and with candles above the 20sma FOR LONGS Attachments:
Marked as spam
Answered on March 26, 2017 2:42 pm
|
|||||||
|
Private answer
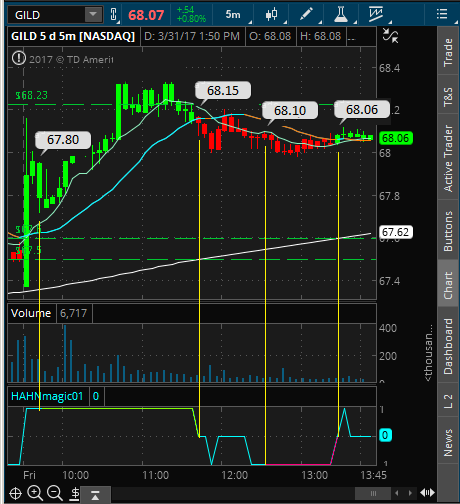
Mr Hahn, I had to log in through twitter because through facebook not working out Im already using this study where the bars are colored in GREEN above the 20sma, and colored in RED below the 20sma. and also This other script, when the 20sma is angled uptrend the line becomes BLUE and when angled downtrend the line becomes ORANGE so as i told you before, I’m trying to finish this study To combine these two features, I’ve even made this image below so you can better understand what we’re looking for here
CONDITION 1 [plus 1]= will alert me when the moving average is directed upwards and with candles above the 20sma FOR LONGS (green candles and the sma colored in blue)
CONDITION 0 [zero] = (green candle and 20sma in orange) OR (red candle and 20sma in blue)
Attachments:
Marked as spam
Answered on March 28, 2017 12:52 pm
|
|||||||
|
Private answer
exactly and remain in condition -1, during the period that condition -1 is being respected See this screenshot below Attachments:
Marked as spam
Answered on March 29, 2017 12:28 pm
|
|||||||
|
Private answer
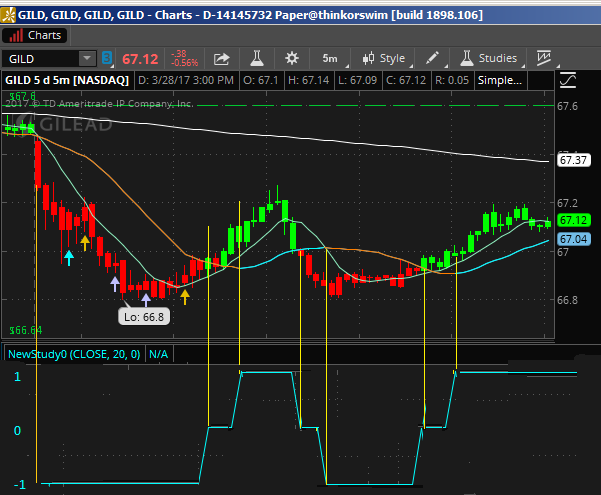
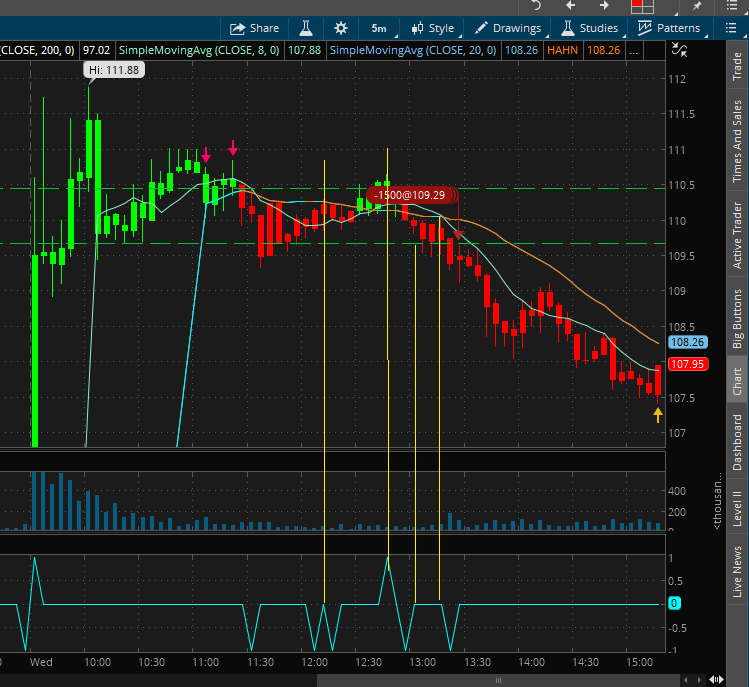
Hey Pete, See this image below For this final tweak on the code, FOR THE LONG SIDE, the color of the line on that lower subgraph should turn green every time if forms At least 3 candles in [condition 1], and will lose the green color As soon as it loses [condition 1] AND FOR THE SHORT SIDE, the color of the line on that lower subgraph should turn magenta every time if forms At least 3 candles in [condition -1], and will lose the magenta color As soon as it loses [condition -1] Also, It Should indicate in the chart Just above the candle, the price of entry and exit for the period the line was green, and the price of entry and exit the period when that line was magenta def sma1 = Average(close, 20); plot signal = if close > sma1 and sma1 > sma1[1] then 1 else if close < sma1 and sma1 < sma1[1] then -1 else 0; For you who that have great experience with thinkorswim, would quickly solve this with some command lines. Trade safe ! Attachments:
Marked as spam
Answered on March 31, 2017 11:49 am
|
|||||||
|
Private answer
Cheers! Marked as spam
Answered on April 5, 2017 3:07 pm
|
thanks for the support Pete, We are almost there
I’m wondering how to change this so it appears just like that lower subgraph I sketched in the screenshot,
Like, for it to change only between these 3 scenarios [+1], [0] and [-1]
is that even possible?
plot signal = if alertUp then 1 else if alertDown then -1 else 0;