| ♥ 0 |
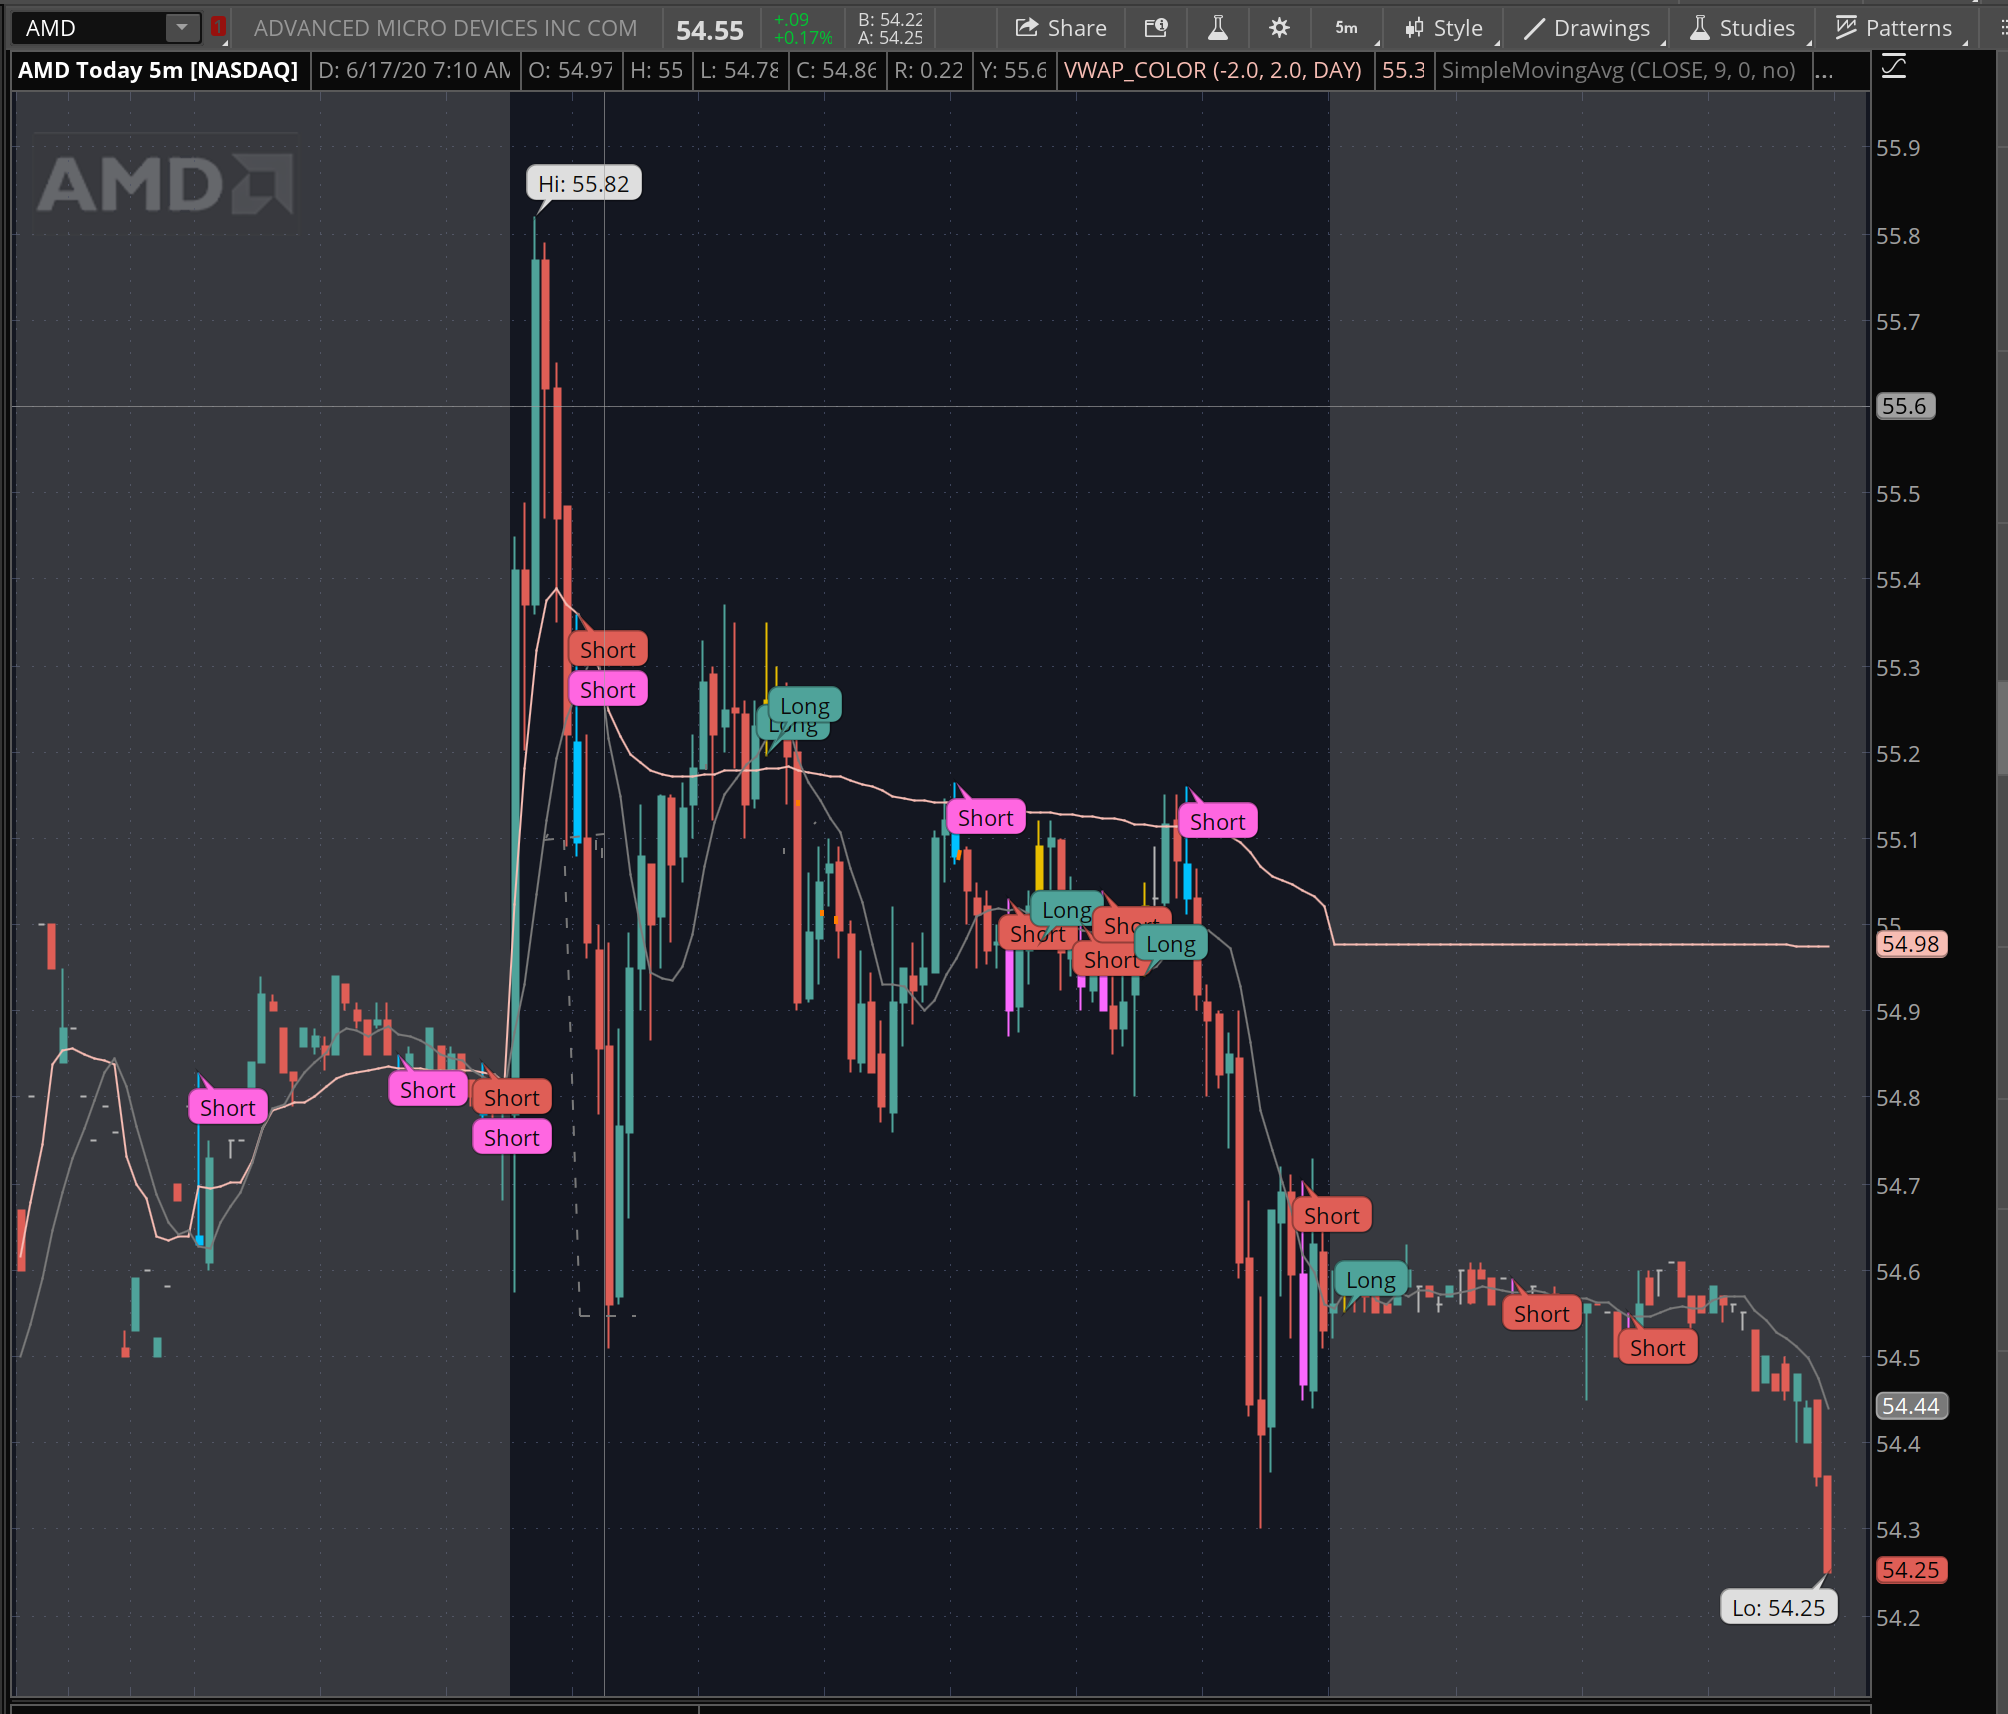
Hello again. I have made a cool chart study that uses the Assign color Feature and am practicing setting up sound alerts as well as chart bubbles. Ive assigned color to wicking candles that cross SMA and VWAP. Thing is theres so many bubbles! Though when Im zoomed in on an intraday chart its not so bad, but the bubbles hang off to the right, sometimes covering the next candle. I wish that I knew a way to make them a bit ( A lot..) more see though. Heres my clustered screen shot. I know how to make chart color more transparent in the Select Color menu. Having trouble finding a solution to adding this to my think script, which Ive pasted below. Hoping theres a way —– addchartbubble (Hammer_Long, low, “Long”, createColor(79,163,154), yes); addChartBubble (Hammer_Short, high, “Short”, createcolor(223,94,86), no); addchartBubble (VwAP_LONG , low, “Long”, createcolor(0,194,255), yes); addchartBubble (Vwap_SHORT, high, “Short”, Createcolor(255,102,225), no); Attachments:
RESOLVED
Marked as spam
|
|
Private answer
You did not provide a fully functional section of code so this solution cannot provide a direct solution to your request. However I was curious about your request and decided to do a bit of research. I learned something new, so thank you for that. I love to learn new things, which is one of the reasons I enjoy teaching. So what did I learn?
I have been asked if it were possible to adjust the transparency of chart elements such as chart labels, plots and chart bubbles in the past. But I was not aware that color transparency could be manually adjusted through user settings. So excited to learn about this, really cool. I can confirm that we cannot set transparency directly within our code. Thinkorswim provides only one method for creating custom colors and it uses only the RGB values and lacks the Alpha input which sets transparency. Details here: https://tlc.thinkorswim.com/center/reference/thinkScript/Functions/Look---Feel/CreateColor Perhaps someday this will be added. Until then, we do have a couple of ways to work around this. In the code below I create a test study that plots chart bubbles and sets the color using the DefineGlobalColor() function. Details here: https://tlc.thinkorswim.com/center/reference/thinkScript/Functions/Look---Feel/DefineGlobalColor Here is the code to build the test study:
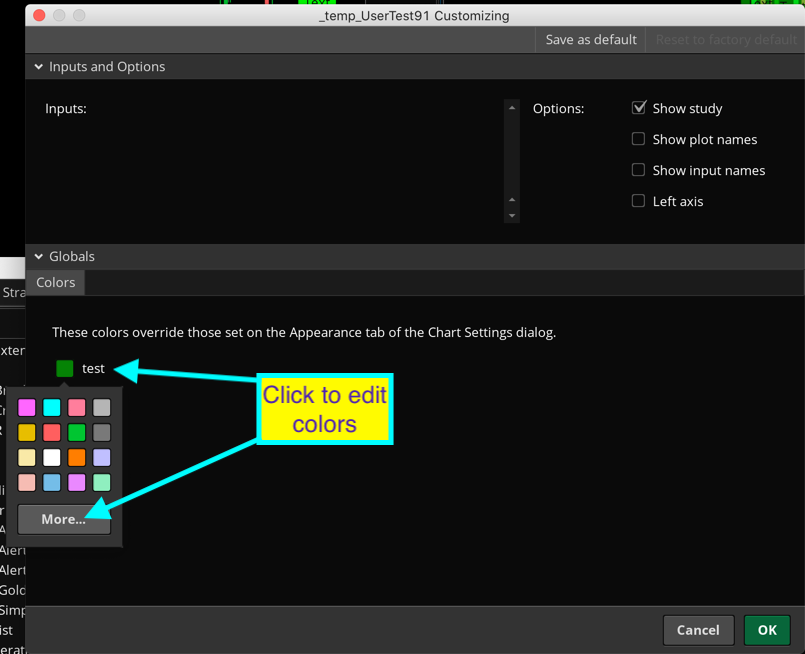
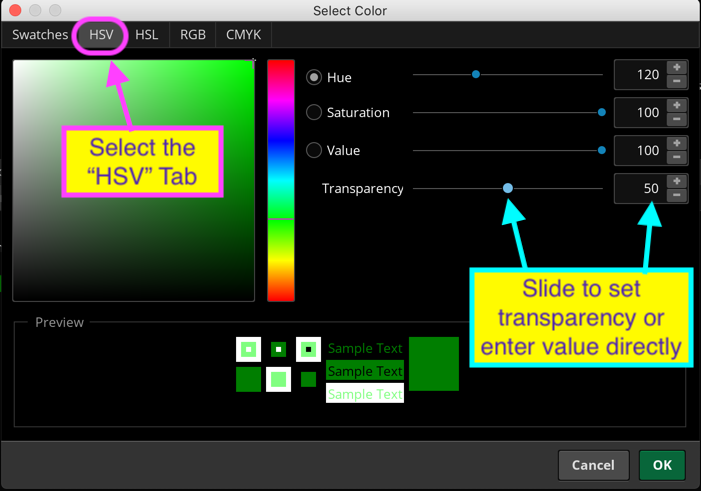
First screenshot below shows how to access the color pallet from user settings which is created by the DefineGlobalColor() function. Second screenshot shows where to go to adjust transparency and the final screenshot shows the comparison with the transparency applied to the right side chart. Attachments:
Marked as spam
Answered on June 18, 2020 8:09 am
|
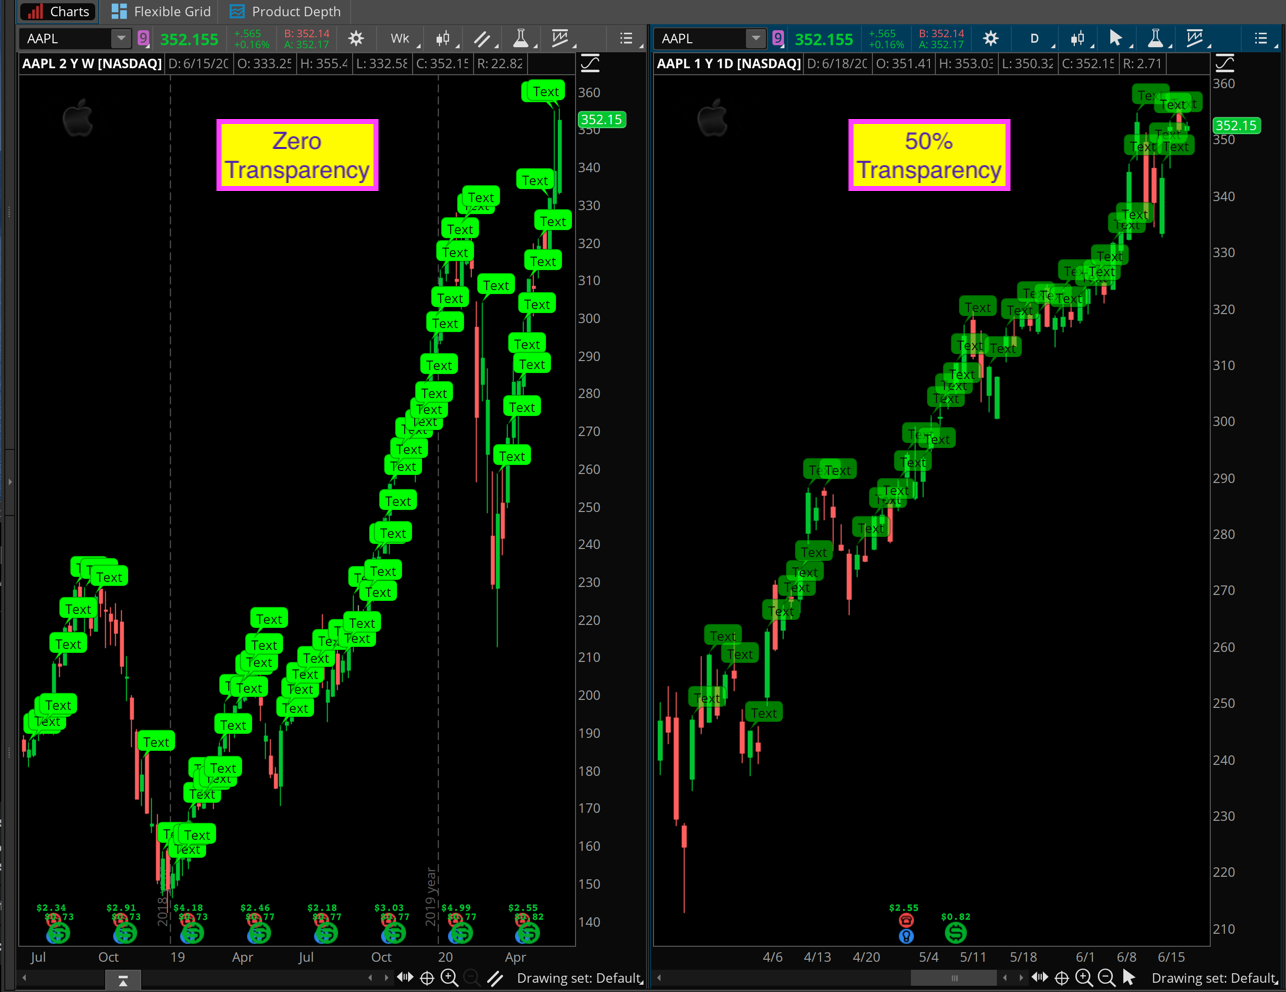
We cannot change the color of the text in chart bubbles. Otherwise that is a really excellent idea. But it does work for anyone using a white or light colored background for their charts!