I moved this question out of the "Strategy Guide" topic and into the "Chart Studies" topic. The Strategy Guide topic is meant for questions related to back-testing chart strategies and Conditional Orders. Your question is for a chart study so it should have been posted there instead.
The code you have there is working fine. Nothing wrong with it. The problem is that when a chart study contains only volume information the platform places the chart study in the Volume Subgraph. And if your chart is set so the volume subgraph is turned off, the study appears to be missing from the chart. But it is not.
Solution:
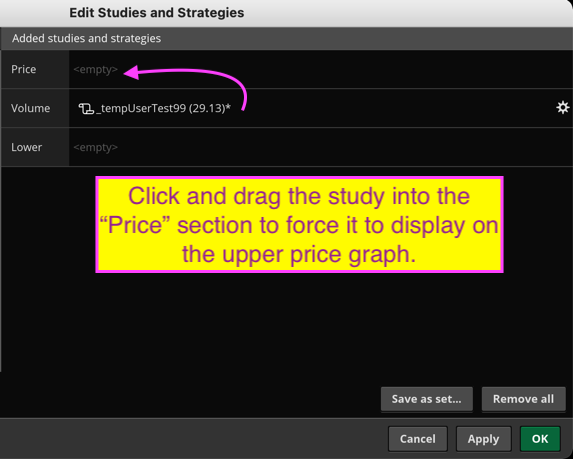
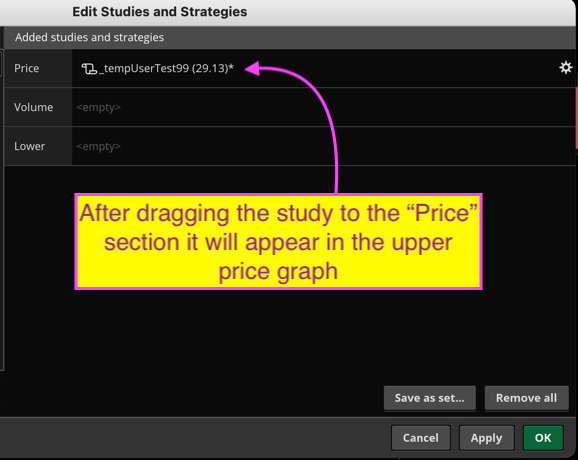
In the Edit Studies view, locate the study that has been placed in the "Volume" section and click and drag it into the Price section of one of the Lower sections.
I have included two screenshots below to demonstrate the steps required to make this adjustment.