Close crossed EMA as least once since market open


Category:
0
0

Hi,

I took a stab at this but now I am asking you Mr Hahn for some assistance.
After searching online and throughout this forum, I couldn’t find anything solid.
What I am looking to accomplish is run a scan where the close crosses below the 9 EMA at least once since market open.

This is what I have so far but I am unsure how to get it since market open.

def EMA = ExpAverage(close, 9);
def closeXBelowEMA = close crosses below EMA;

plot scan = closeXBelowEMA;

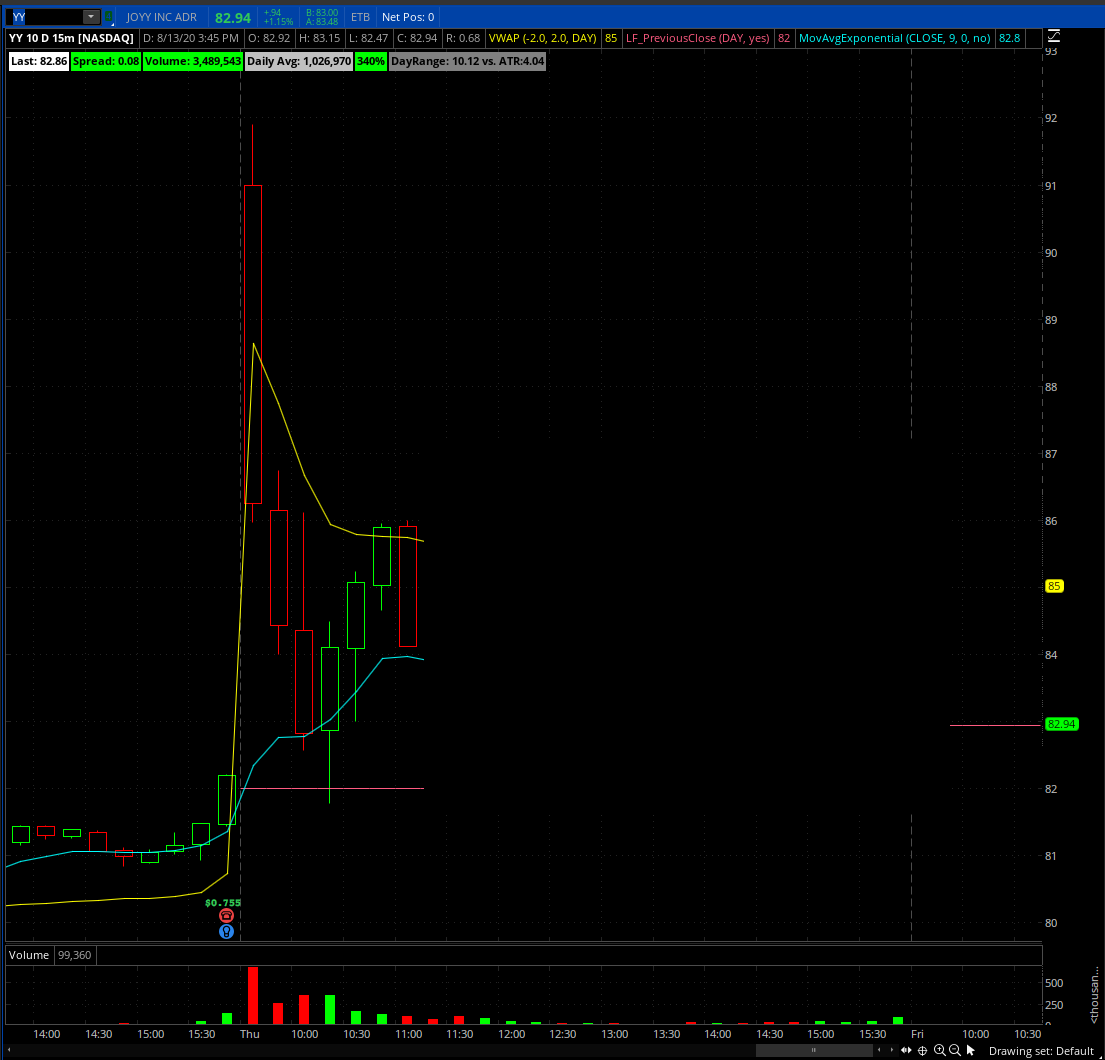
What’s difficult to achieve, due to my limited knowledge, is how to have the code remain true once the close crossing below the 9 EMA event has occurred. Based on the attached image, once the close crosses back above the EMA, the script would return false; which is what I want to to avoid. I want the script to remain true even in cases where the close crosses back above the EMA because there was at least one occurrence of the close crossing below the EMA

Attachments:
Marked as spam
Posted by (Questions: 7, Answers: 13)
Asked on August 13, 2020 7:50 pm
71 views
0
Private answer

The code needs to reset at the opening bar of each trading session. I see your chart did not included extended hours data so my solution also requires that extended hour data NOT be included. Otherwise the results will not work. I also need to mention this will only work for intraday time frames.

The missing piece for you was the use of a recursive variable. I have created a new variable named "newDay" that is used to reset the signal for each new trading session. For each bar after the opening bar the code checks if the crossover has occurred. When any crossover occurs the value for "hasCrossedToday" is set to 1 and held for the reminder of the trading session.

Oh and I have included two signals with this scan. The one you requested as well as one that will be triggered on the exact same bar the first crossover of the day occurred.

I have not tested this, but based on my experience it should work:

input numberOfCrosses = 1;
input maLengthOne = 9;
input maTypeOne = AverageType.EXPONENTIAL;
input maPriceOne = close;
def maOne = MovingAverage(maTypeOne, maPriceOne, maLengthOne);
def closeXBelowEMA = close[1] > maOne[1] and close < maOne;
def newDay = GetDay() <> GetDay()[1];
rec hasCrossedToday = if newDay then 0 else if closeXBelowEMA then 1 else hasCrossedToday[1];
# use this to find stocks that have crossed at least once during today
plot scan = hasCrossedToday > numberOfCrosses;
# use this to find stocks that have just crossed for the first time today
#plot scan = hasCrossedToday and !hasCrossedToday[1];

Marked as spam
Posted by (Questions: 37, Answers: 4087)
Answered on August 14, 2020 7:51 am
0
Thank you Peter, very much appreciated. I will back test and let you know.
( at August 16, 2020 9:00 am)
0
Hi Pete, what I’ve done is added your code as a study which is shown as the boolean line towards the bottom of the chart in each photo that is attached so I can view if the price x’d below the 9 EMA. With Plot 1, though there were several events where the price has x’d below the 9 EMA, it is not indicated in the study. In Plot 2, there were several events where the price x’d below the 9 EMA and has triggered the study indicator. However, the one marked with red arrows has touched the 9EMA but no event price x’ing below 9 EMA triggered the indicator. Please advise on what may be the issue Plot 1 and why didn’t an event trigger on stock WKHS 8/25 at 11:30 AM EST for using Plot 2. Thank you so much for your help with this. Very much appreciated. Plot 1 https://i.imgur.com/oRyyImc.png Plot 2 https://i.imgur.com/KUe3At9.png
( at August 31, 2020 6:43 pm)
0
In your screenshots, most of the so-called crossings you pointed out did not include the close of the bar crossing below the EMA. Most of the events you marked were only the low of the bar crossing the EMA. The code uses the close of the bar, just like your original. It does not use the low of the bar.
( at August 31, 2020 8:46 pm)