Close price Breaks out Below/Above PPS Buy/Sell Signal


Category:
0
0

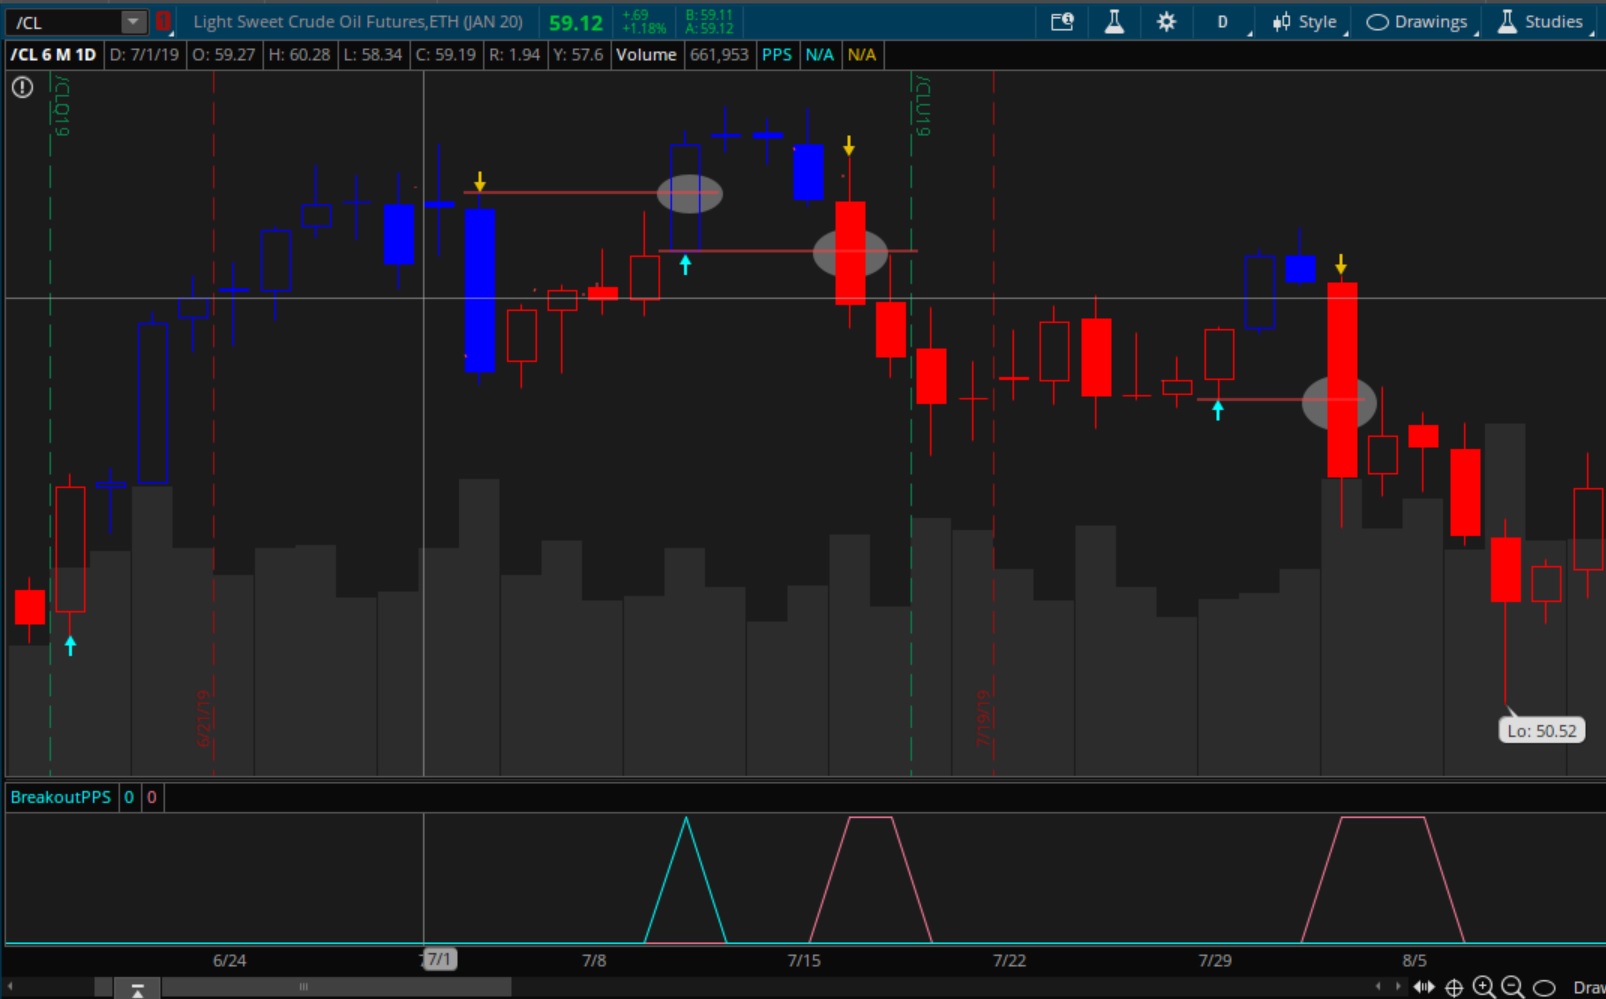
Hi Pete,

Is there a way to simplify my custom script below? If not, is there a way to ignore  the  rest of the statements if one of the first few statement is already true?   Basically, i am trying to write an indicator that i will eventually convert into my column watchlist and scanner to look for a price breakout below LOW if it has PPS Buy and above HIGH if it has PPS Sell. I have attached a picture to help me with my question. Thanks.

plot Bull = 

(PPS().”SellSignal” [1] is true and close >= high [1])

or

(PPS().”SellSignal” [2] is true and close >= high [2])

or

(PPS().”SellSignal” [3] is true and close >= high [3])

or

(PPS().”SellSignal” [4] is true and close >= high [4])

or

(PPS().”SellSignal” [5] is true and close >= high [5])

or 

(PPS().”SellSignal” [6] is true and close >= high [6])

or

(PPS().”SellSignal” [7] is true and close >= high [7])

or

(PPS().”SellSignal” [8] is true and close >= high [8])

;

plot Bear = 

(PPS().”BuySignal” [1] is true and close <= low [1])

or

(PPS().”BuySignal” [2] is true and close <= low [2])

or

(PPS().”BuySignal” [3] is true and close <= low [3])

or

(PPS().”BuySignal” [4] is true and close <= low [4])

or

(PPS().”BuySignal” [5] is true and close <= low [5])

or

(PPS().”BuySignal” [6] is true and close <= low [6])

or

(PPS().”BuySignal” [7] is true and close <= low [7])

or

(PPS().”BuySignal” [8] is true and close <= low [8])

;

Attachments:
Marked as spam
Posted by (Questions: 8, Answers: 2)
Asked on December 6, 2019 9:30 pm
196 views
0
Private answer

Since you are requesting a chart study, I am moving this post out of the "Strategy Guide" topic and into the "Chart Studies" topic.

Here is the solution:

#---------- Plot the PPS Signals
plot buy = !IsNaN(PPS().”buySignal”);
buy.SetPaintingStrategy(PaintingStrategy.BOOLEAN_WEDGE_DOWN);
buy.SetDefaultColor(Color.DARK_RED);
buy.SetLineWeight(3);
plot sell = !IsNaN(PPS().”SellSignal”);
sell.SetPaintingStrategy(PaintingStrategy.BOOLEAN_WEDGE_UP);
sell.SetDefaultColor(Color.DARK_GREEN);
sell.SetLineWeight(3);
#---------- Track the high/low at PPS buy/sell
rec trackHigh = if sell then high else trackHigh[1];
rec trackLow = if buy then low else trackLow[1];
plot highAtSell = trackHigh;
highAtSell.SetDefaultColor(Color.DARK_GREEN);
plot lowAtBuy = trackLow;
lowAtBuy.SetDefaultColor(Color.DARK_RED);
#---------- Mark candles that break high/low
plot breakOfLow = close[1] > trackLow[1] and close < trackLow;
breakOfLow.SetPaintingStrategy(PaintingStrategy.BOOLEAN_ARROW_DOWN);
breakOfLow.SetDefaultColor(Color.CYAN);
breakOfLow.SetLineWeight(3);
plot breakOfHigh = close[1] < trackHigh[1] and close > trackHigh;
breakOfHigh.SetPaintingStrategy(PaintingStrategy.BOOLEAN_ARROW_UP);
breakOfHigh.SetDefaultColor(Color.MAGENTA);
breakOfHigh.SetLineWeight(3);

Marked as spam
Posted by (Questions: 37, Answers: 4087)
Answered on December 7, 2019 9:08 am