Ok, I traded a few emails with Wayne to clarify the volume parameter of his alert condition. We will be applying a 14 period simple moving average to the volume and then comparing each bar’s individual volume with that moving average. We’ll apply a multiplier of 1.25 to this comparison to be in line with the ATR multiplier. There are several steps required here so if you get lost just scrap everything and start over. I have provided some screenshots below with comments and mark ups to highlight the significant steps.
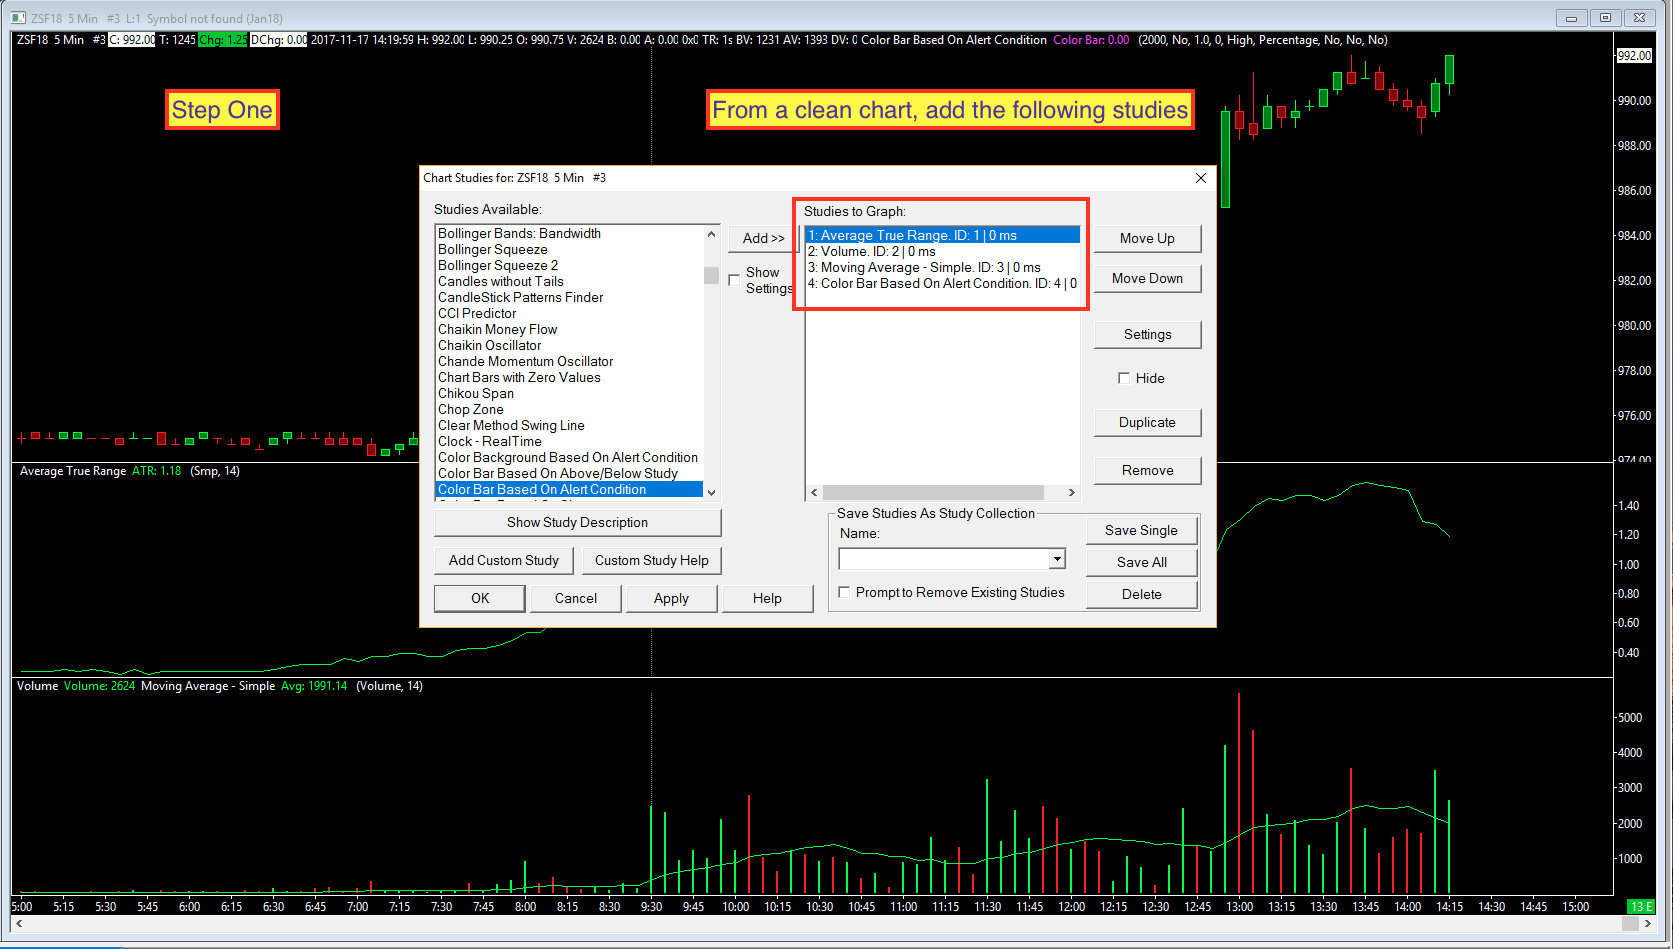
Step One:
Add the following studies to a clean chart: Average True Range, Volume, Moving Average – Simple and Color Bar Based On Alert Condition. (be sure to apply them to the chart in this exact order)
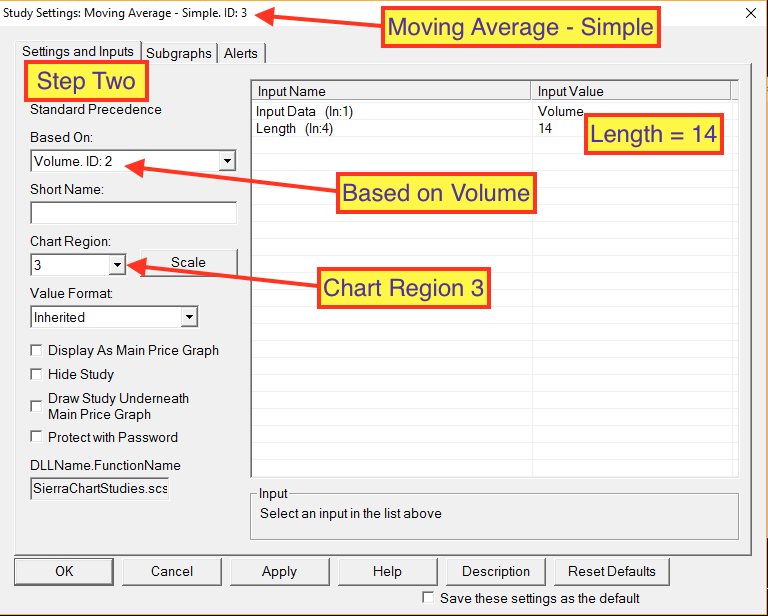
Step Two:
Select the Moving Average – Simple and click the Settings button. Set the study to be based on the Volume study and set it to Chart Region 3. Don’t forget to adjust the length to 14.
After clicking Apply your chart should appear as shown (but the color bars will not appear just yet).
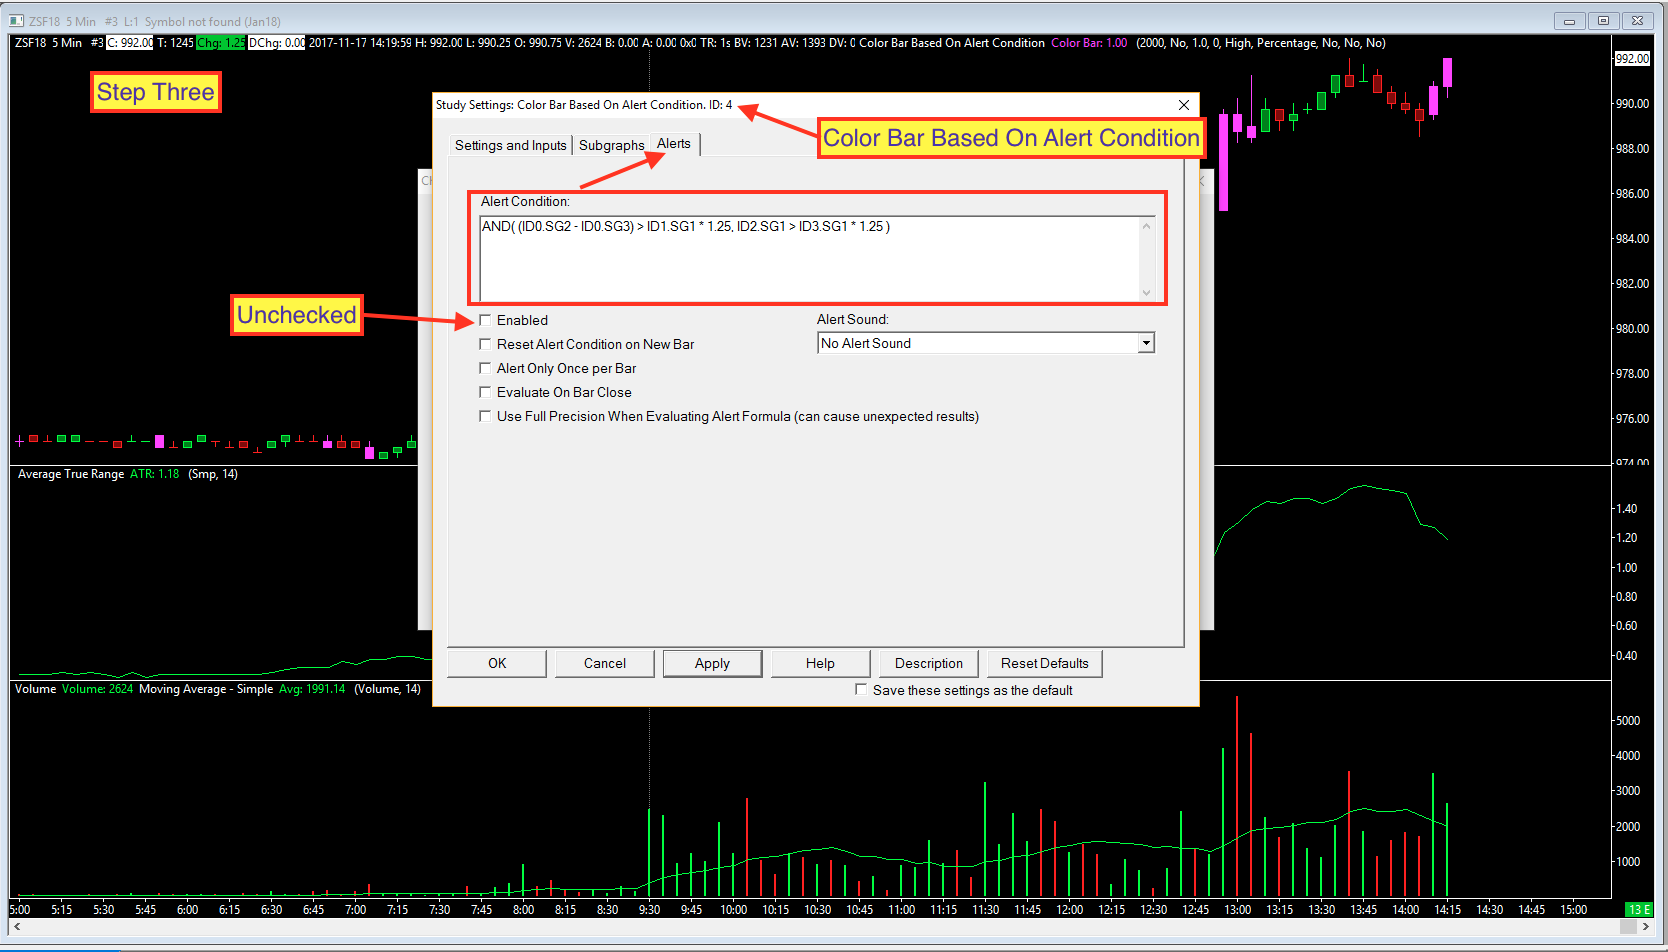
Step Three:
Here is the hardest part. Building the alert formula. Notice the screenshot from step one. Look for the ID# of each study. We’ll use those ID#’s to reference each study in our formula. What is not shown is the OHLC data from the chart. Those are always set to ID0. So the High is ID0.SG2 and the low is ID0.SG3. Got that? O,H,L,C = (ID0.SG1, ID0SG2, ID0.SG3, ID0.SG4). So using the ID#’s and SG#’s we’ll be performing the following math:
(High – Low) > ATR * 1.25 AND Volume > AvgVolume * 1.25)
There, wasn’t that simple? So here is what that looks like when we convert each of those elements to the proper ID# and SG#:
AND( (ID0.SG2 - ID0.SG3) > ID1.SG1 * 1.25, ID2.SG1 > ID3.SG1 * 1.25 )
You just copy that formula then open the Color Bar Based On Alert Condition study, go to the Alerts tab and paste the formula in that box. Just as shown in the screenshot. (I also unchecked the Enabled option)
Done. Congratulations!