Color plot green for uptrend and red for downtrend


Category:
0
0

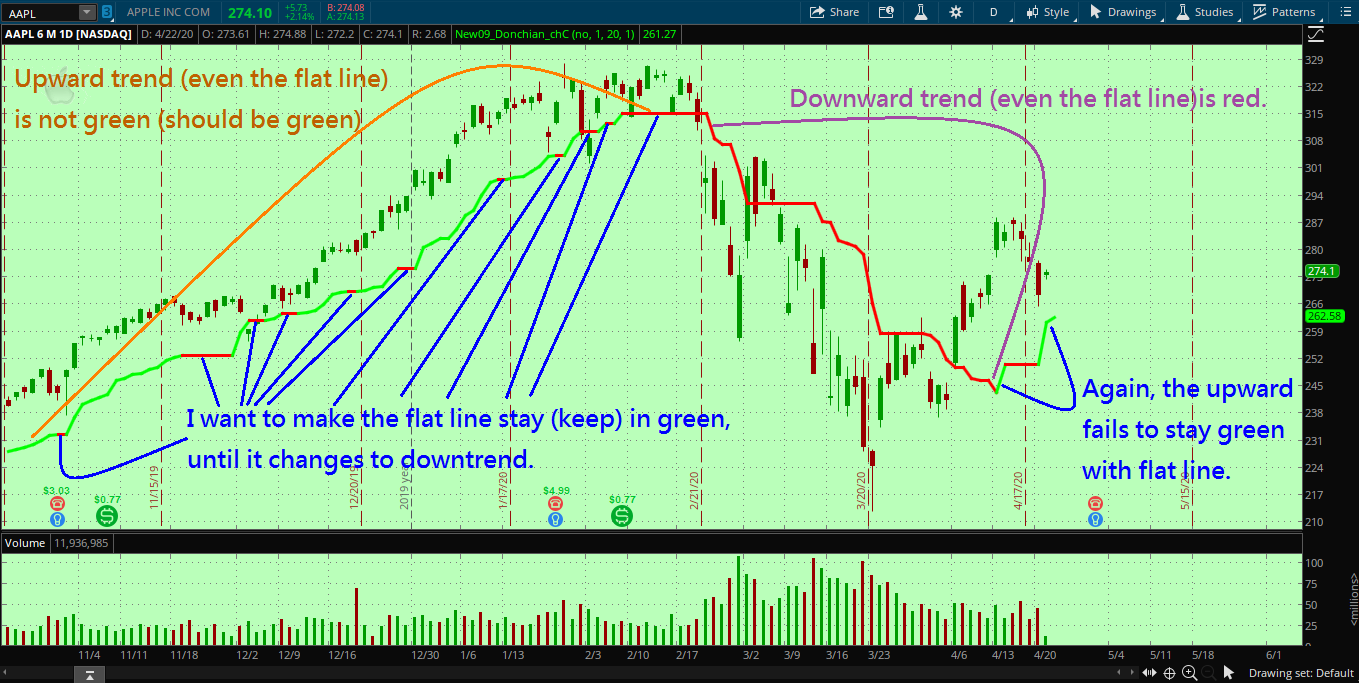
Hi Pete,

I’m stuck with the color problem.  The color fails to stay(keep) in green during/within the upward trend (even with the flat lines among upward trend), and I’ve tried many different ways but couldn’t get the color right.  Here’s my thinkscript code as follows:

#===============================

declare upper;

def HH = Highest(high[1], 20);
def LL = Lowest(low[1], 20);
plot MM = (HH + LL) / 2;

MM.DefineColor(“Up”, color.green);
MM.DefineColor(“Down”, color.red);

MM.AssignValueColor( if MM>MM[1] then MM.Color(“Up”) else MM.Color(“Down”));
MM.SetLineWeight(3);

#==========================================================#

My logic is to make the 1st upward line turn to (stay in) green even with the flat line until it hits the 1st downward trend even with the flat line until it hits the 1st upward line.

However, I’ve tried to modify my code but fail to make my logic work.  Could you help me to fix this LINE color problem?  Thanks in advance!

Attachments:
Marked as spam
Posted by (Questions: 1, Answers: 1)
Asked on April 22, 2020 10:45 am
138 views
0
Private answer

Try using this instead:

MM.AssignValueColor( if MM >= MM[1] then MM.Color(“Up”) else MM.Color(“Down”));

However then you will have a new problem, The red line will not long be solid red. You must use recursion in this study to capture and hold the change of direction.

Marked as spam
Posted by (Questions: 37, Answers: 4087)
Answered on April 22, 2020 3:55 pm
0
Thanks for the reply. But my following recursion not working, could you help me a bit more in recursion? appreciated. def Up = MM >= MM[1]; def Dn = MM <= MM[1]; MM.AssignValueColor( if Up == 1 then MM.Color("Up") else MM.Color("Down"));
( at April 22, 2020 6:12 pm)
0
There is no recursion in that code you just posted. And you have a problem because you are using the equal sign in both the Up and Dn variable statements. Which means that both can be true at the same time. Not good. I believe you in over your head.
( at April 22, 2020 8:33 pm)
0
Private answer

Here is the solution you requested. Notice I have adjusted your code to conform to standardized style conventions which include verbose variable names and camelCase.

def highestHigh = Highest(high[1], 20);
def lowestLow = Lowest(low[1], 20);
plot midPoint = (highestHigh + lowestLow) / 2;
midPoint.DefineColor(“Up”, color.green);
midPoint.DefineColor(“Down”, color.red);
rec trackLastState = if midPoint > midPoint[1] then 1 else if midPoint < midPoint[1] then -1 else trackLastState[1];
midPoint.AssignValueColor( if trackLastState == 1 then midPoint.Color(“Up”) else if trackLastState == -1 then midPoint.Color(“Down”) else Color.DARK_GRAY);
midPoint.SetLineWeight(3);

Marked as spam
Posted by (Questions: 37, Answers: 4087)
Answered on April 22, 2020 8:40 pm
0
Thanks a million! BTW, I know ..... then 1 ( 1 is true ), what is -1 ( 0 is false, but I have no idea what is -1, could you explain what doesn't -1 mean?) Thanks again and wish you a nice day.
( at April 23, 2020 6:47 am)
0
The 1, 0 or -1 are just values I assigned because there can be three possible results. I could have just as easily used value of 1, 2, or 3. But for me, I tend to treat uptrend as positive and downtrend as negative then this leaves zero as neutral.
( at April 23, 2020 7:13 am)
0
Thanks for guiding/explanation!
( at April 23, 2020 7:38 am)