Color watchlist based on custom Squeeze study


Category:
0
0

Pete

I have a chart study that colors the candlesticks…Could I have this in the watch list as well..If the bar is red on chart the watch list will have a red bar. I would like this for all four colors…


input nBB = 2.0;
input Length = 20.0;
input nK = 1.5;
input price = close;
input earlyEntrySmoothing = 7;
input earlyExitSmoothing = 9;
def momentum = TTM_Squeeze(price = price, length = length, nk = nk, nbb = nbb).”Histogram”;
def OA = linearRegressionSlope(price = momentum-momentum[1], length = earlyExitSmoothing);
def BolKelDelta = reference BollingerBands(“num_dev_up” = nBB, “length” = Length ).”upperband” – KeltnerChannels(“factor” = nK, “length” = Length).”Upper_Band”;
def BKDA = ExpAverage(BolKelDelta, earlyEntrySmoothing);
DefineGlobalColor(“Up”, CreateColor(0, 255, 255));
DefineGlobalColor(“UpDecreasing”, CreateColor(0, 0, 255));
DefineGlobalColor(“Down”, CreateColor(255, 0, 0));
DefineGlobalColor(“DownDecreasing”, CreateColor(255, 255, 0));
def EarlyEntry = BolKelDelta > BKDA and BolKelDelta <= 0;
assignPriceColor (if EarlyEntry then color.green else if momentum >= 0 and momentum > momentum[1] and (OA > 0 or OA <=0 and bolKelDelta <0) then GlobalColor(“Up”) else if Momentum >=0 then GlobalColor(“UpDecreasing”) else if momentum < momentum[1] and (OA < 0 or OA >=0 and bolKelDelta < 0) then GlobalColor(“Down”) else GlobalColor(“DownDecreasing”));


Attachments:
Marked as spam
Posted by (Questions: 49, Answers: 42)
Asked on January 26, 2019 12:05 pm
192 views
0
Pete After I did what you said it wouldn’t allow me to save
( at January 27, 2019 1:58 pm)
0

It also said one plot should be defined

( at January 27, 2019 2:06 pm)
0

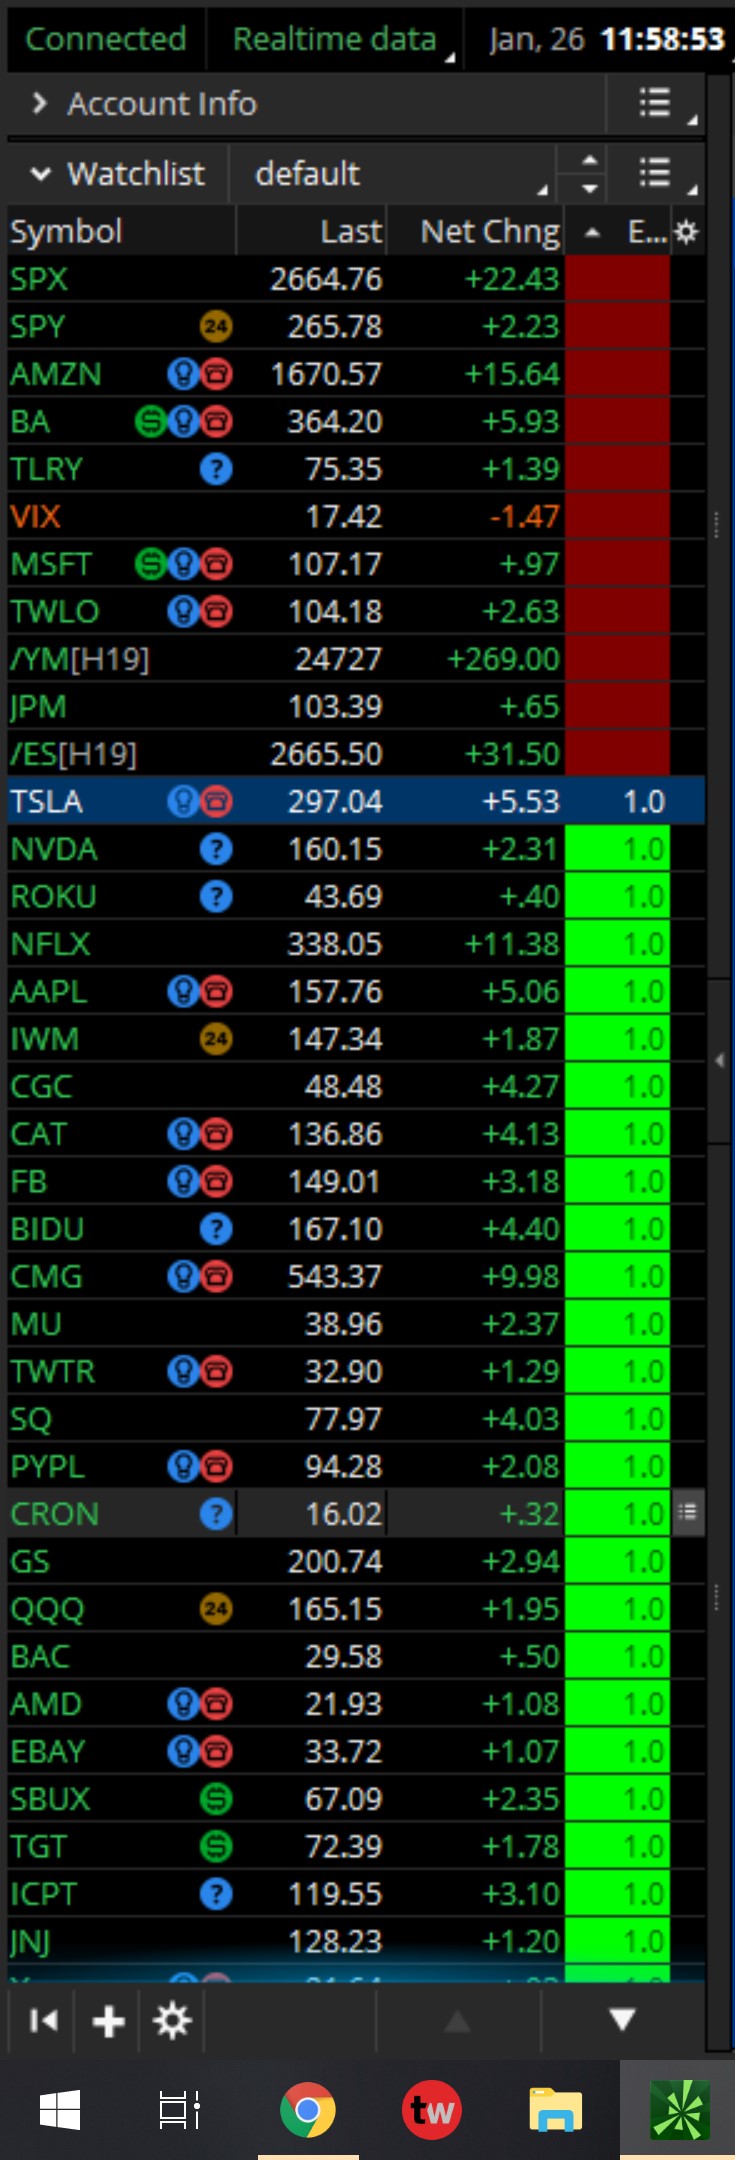
I also want to be clear in what I’m looking for. this is a color column for a watch list first off. I’m hoping you can make the column color the current bar on the chart.

( at January 27, 2019 7:18 pm)
0

Well if the error says “at least one plot should defined” then simply add one. I added “plot data = 0” and it let me save the code. The colors should match exactly because we are using the same exact statement to color the cells of the watchlist that are used to color the bars on the chart.

( at January 28, 2019 10:32 am)
0
Private answer

Pretty sure you only need to change the last line of code. Replace the word “assignPriceColor” with “AssignBackgroundColor”.

For a watchlist, assignPriceColor impacts the color of the text/values. While AssignBackgroundColor impacts the color of the cells.

Update: Here is the full code with the changes applied

input nBB = 2.0;
input Length = 20.0;
input nK = 1.5;
input price = close;
input earlyEntrySmoothing = 7;
input earlyExitSmoothing = 9;
def momentum = TTM_Squeeze(price = price, length = length, nk = nk, nbb = nbb).”Histogram”;
def OA = linearRegressionSlope(price = momentum-momentum[1], length = earlyExitSmoothing);
def BolKelDelta = reference BollingerBands(“num_dev_up” = nBB, “length” = Length ).”upperband” – KeltnerChannels(“factor” = nK, “length” = Length).”Upper_Band”;
def BKDA = ExpAverage(BolKelDelta, earlyEntrySmoothing);
def EarlyEntry = BolKelDelta > BKDA and BolKelDelta <= 0;
plot data = if EarlyEntry then 1 else if momentum >= 0 and momentum > momentum[1] and (OA > 0 or OA <=0 and bolKelDelta <0) then 2 else if Momentum >=0 then 3 else if momentum < momentum[1] and (OA < 0 or OA >=0 and bolKelDelta < 0) then 4 else 5;
data.SetDefaultColor(Color.BLACK);
AssignBackgroundColor(if EarlyEntry then color.green else if momentum >= 0 and momentum > momentum[1] and (OA > 0 or OA <=0 and bolKelDelta <0) then CreateColor(0, 255, 255) else if Momentum >=0 then CreateColor(0, 0, 255) else if momentum < momentum[1] and (OA < 0 or OA >=0 and bolKelDelta < 0) then CreateColor(255, 0, 0) else CreateColor(255, 255, 0));

Marked as spam
Posted by (Questions: 37, Answers: 4079)
Answered on January 27, 2019 11:54 am
0

Does it matter where the plot goes

( at January 29, 2019 10:55 am)
0

Could you copy and paste the code that worked for you…

Thanks

( at January 29, 2019 11:14 am)
0

I have updated my answer to include the full code that works. Now I am going to update the title so that it describes the content of the question.

( at January 29, 2019 1:53 pm)
0

Pete
All cells are white except 1

( at January 29, 2019 3:35 pm)
0

Turns out we have uncovered a glitch in Thinkscript for watchlist columns. DefineGlobalColor is not supported. I adjusted the code in my answer to avoid the glitch and it should work correctly now.

( at January 30, 2019 12:09 pm)