| ♥ 0 |
im back again 🙂 …lol… any way you can help me out with another simple problem with this thinkskript study. what i am trying to achieve is the following as study like this: Current Bar/TICK <VOLUME/PRICE> is <GREATER/LESS> <NUMERICAL INPUT> so it would pretty much be like…current tick for volume is greater than 1K, but i wanna be able to type/choose the <INPUTS> via the thinkorswim GUI the fartherst i could get is the code below, but i obviously did something wrong because it wont accept the code
<pre> #Wizard text: Current bar’s input price = volume; plot scan; switch (Choice){ </pre>
Marked as spam
|
|
Private answer
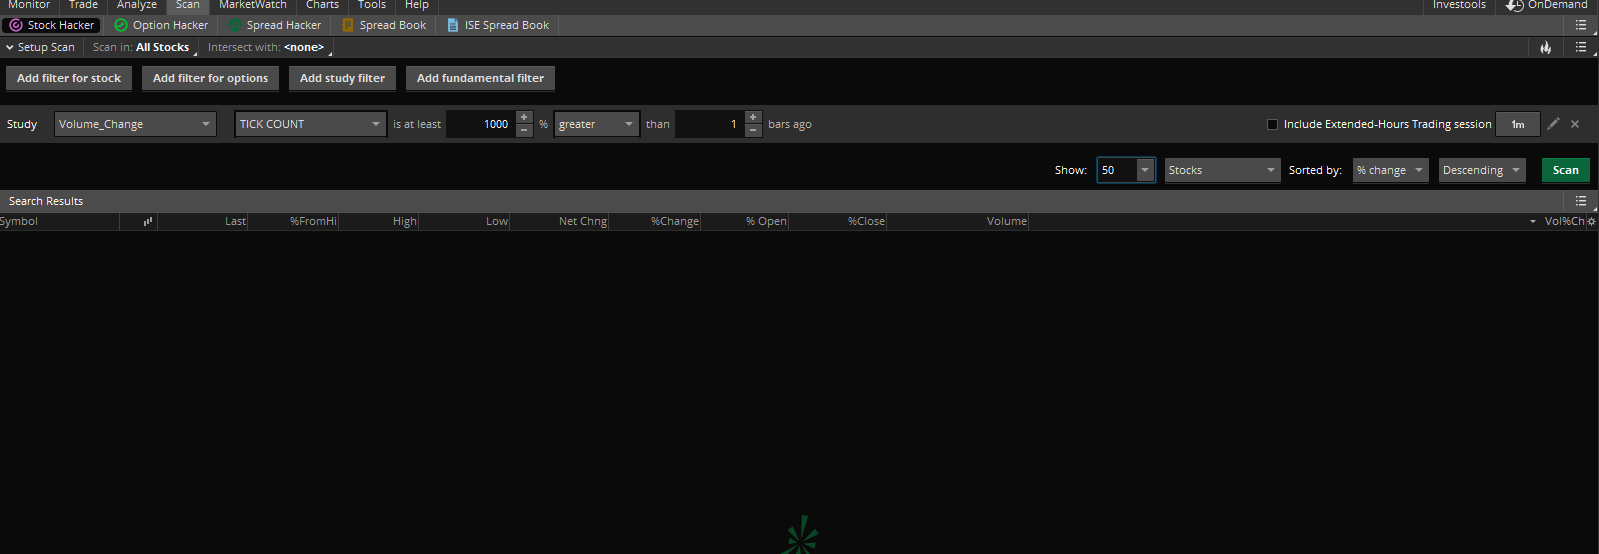
ok, in the picture attached there is a default study for volume tick count percentage, but i dont want percentage, i want it for a for the actual volume. in charting stock, normally there are a certain amount of “ticks” in every bar, its the smallest amount to analyze, i can settle for bar instead of ticks if you dont know how to define ticks in thinkscript because i couldnt find reference either and i know TOS get their ticks in blocks anyways, vs actual ticks. so end of day even tho i would prefer tick i can settle for bar. so to reword it… the volume of the current bar is <greater/less> than <numberical number> example: the volume of the current bar is greater than 10K
Attachments:
Marked as spam
Answered on April 7, 2017 6:11 pm
|
|||||
|
Private answer
btw: thanks for the help, and take your time and rest, im in no rush bro. i know we all got lives and stress. LoL ive been super stressed lately, tax season! boo! Marked as spam
Answered on April 7, 2017 6:14 pm
|
|||||
|
Private answer
Ah ok. Thanks for providing that screenshot and additional details. I found documentation on that here: http://tlc.thinkorswim.com/center/reference/thinkScript/Functions/Fundamentals/tick-count.html It just a price type. (Open, High, Low, Close, Volume and Tick_Count) sort of thing. Notice that Tick_Count is only valid for intraday time frames. This code should do the trick. Unfortunately there is no way I have found to convert the inputs of a custom scan filter into clickable inputs the way the built in studies work. So in order to change one of the inputs you have to do so directly within the script itself. For example for the priceType input. You would change that from “volume” to “tick_count” by moving the word default to in front of the “tick_count” option. Likewise for the comparison input.
Marked as spam
Answered on April 7, 2017 7:03 pm
|
|||||
|
Private answer
In response to further details provided by Dave on March 14, 2018:
Should work. Although I haven’t tested it. Marked as spam
Answered on March 14, 2018 12:40 pm
|
I’m just shutting down for the day but wanted to make sure I understood the request. I’ll respond late tonight or sometime tomorrow. ”Current tick for volume” is confusing me. Here is your specification:
Current Bar/TICK (VOLUME/PRICE) is (GREATER/LESS) (NUMERICAL INPUT)
I get the Volume/Price: ( select either volume or price)
I get the Greater/Less: (select either greater or less)
I don’t get Current Bar/Tick. Is this supposed to be a choice? Select either Bar or Tick? In this context, what is Tick?
The part I understand is you want to scan for current Bar’s (volume or price) is (greater than or less than) the input value. I need you to clarify what you mean by Tick.