Custom Watchlist Column -Days Since Pocket Pivot


Category:
0
0

Would appreciate if I could get some help with the custom column counting the days since last triggered Pocket Pivot. I have tried using the recursive count function but I am getting only zeros in the column count. Attached is the TOS thinkscript fore reference.

Marked as spam
Posted by (Questions: 5, Answers: 7)
Asked on June 4, 2020 8:01 am
35 views
0
Private answer

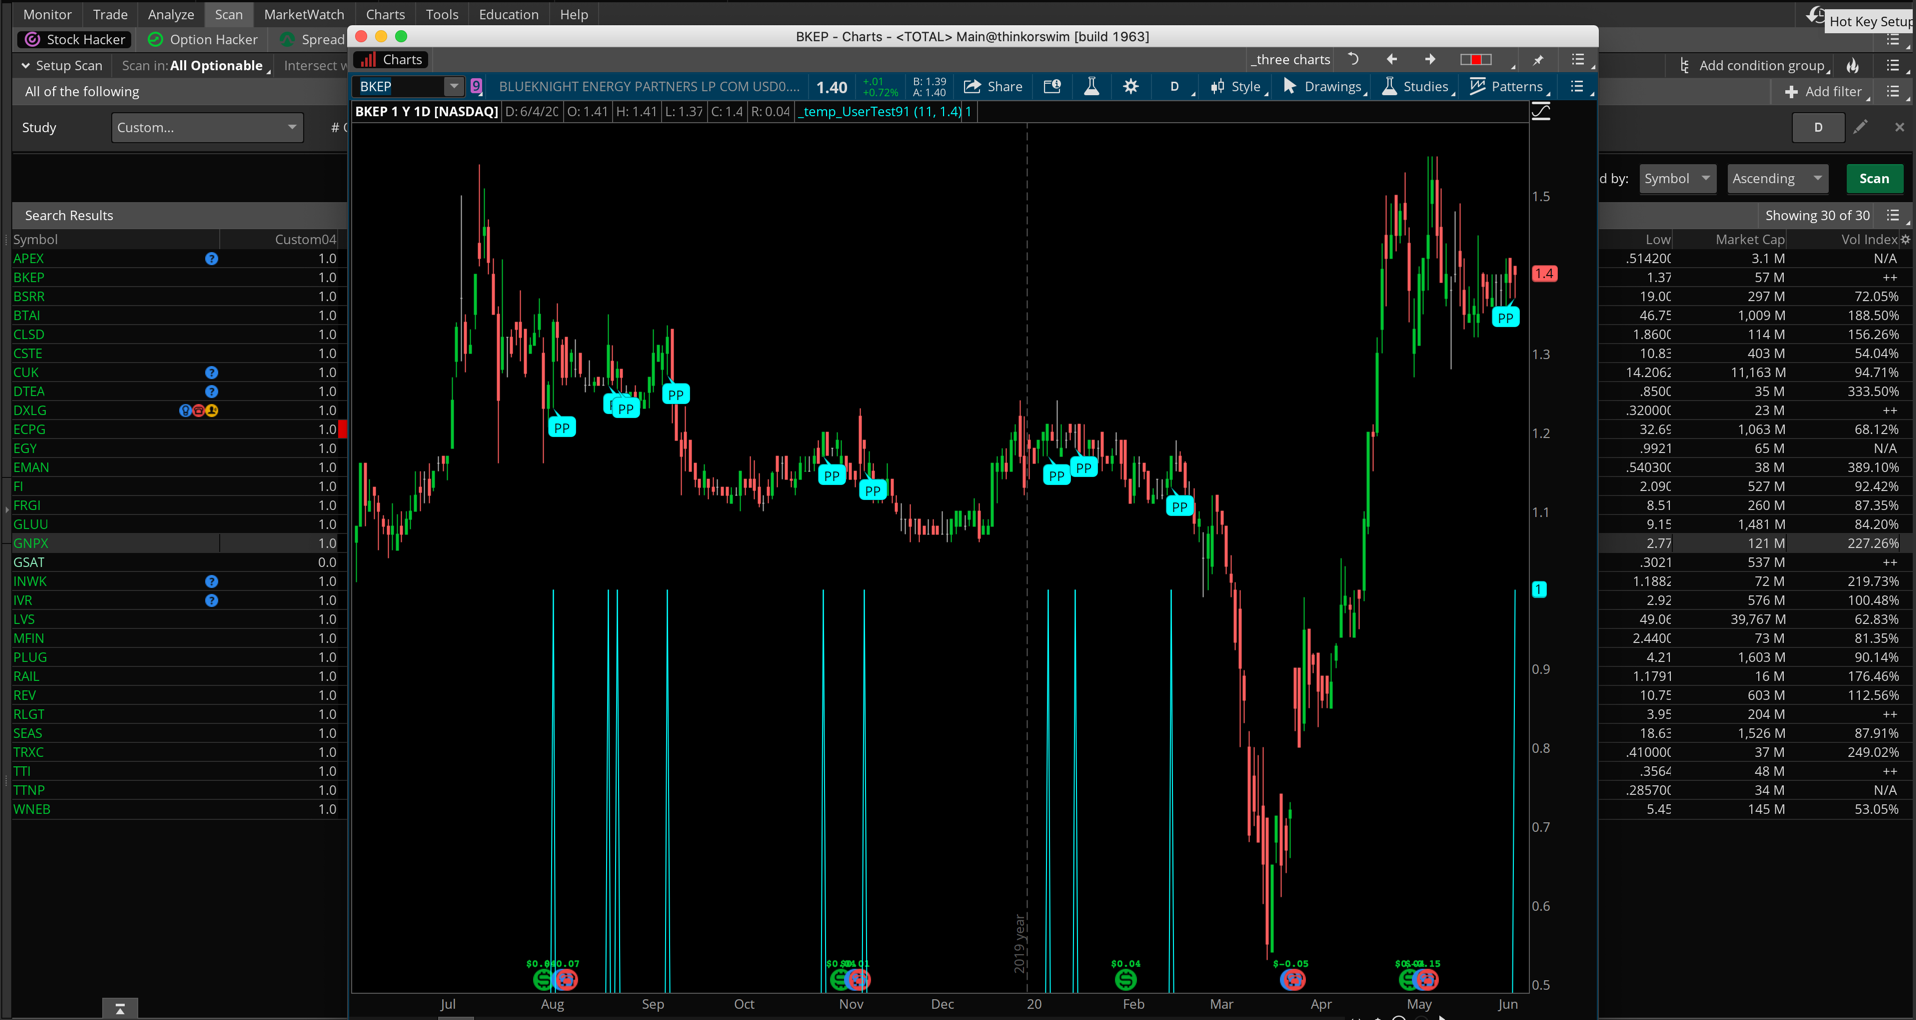
First and foremost: The code contains a copyright notice. Do you have permission to publish this code in a public venue? Our terms and conditions strictly forbid posting any code that is not already available in the public domain.

https://www.hahn-tech.com/terms-and-conditions/

The code you presented works perfectly well as you have intended. I used it to build a scan and a custom watchlist column. The scan was used to find stocks meeting the criteria you specified. Then I added a custom column (Custom04) to the results list to show that it does indeed display a value of 1.0 when the condition is present on the current bar.

Screenshot below shows the results.

Edit: In the comments section below we have confirmation the author of the post received permission to post this code. We also learn that I completely missed the point. LOL. Oops! Which was to create statement for this code that would display the number of bars since the last PP was plotted on the chart. Below are the two lines of code that will compute this for the code you provided in the attached plain text file:

def signal = IsVolumeGreaterHighestDownVolume and IsPriceInTheProperRange;
rec countBars = if signal then 1 else countBars[1] + 1;
plot data = countBars;

You will apply this to the bottom of the code provided, removing the existing lines of code immediately below the #Scan comment.

Attachments:
Marked as spam
Posted by (Questions: 37, Answers: 4086)
Answered on June 4, 2020 10:45 am
0
Pete I have personally emailed Scott J and asked his permission to publish the code as long as the credit remains as seen in the thinkscript. Pete I do see the scan work and the custom column update. As a process I take the PP flagged instruments and add them to a separate watchlist everyday since I like to follow the progress of the PP flagged stocks over a period of time. When I add the custom column to that list I do not get the number of days since the PP flag was triggered on the chart and get all zeros. When I add that to a watchlist running the scan for today the watchlist does give me all 1's like in your snapshot. Following is a smaller list which can be used to test this. ACB,MRTX,STX,ORA,FLO,DT,BIO,MSA,WYNN,BYND,AMAT,PDD,OKTA, REGN
( at June 4, 2020 11:07 am)
0
Following is what I expect in the list for days or bars since last PP trigger (including today): ACB 13 MRTX 7 STX 3 ORA 2 FLO 8 DT 3 BIO 9 MSA 8 BYND 4 AMAT 4 PDD 9 OKTA 5 REGN 5
( at June 4, 2020 11:30 am)
0
Oops, totally lost track of that detail about the bar count. I have updated my answer to include this solution.
( at June 4, 2020 12:27 pm)
0
Added the 2 lines under scan but getting a Thinkscript editor error 'at least one plot is needed'.
( at June 4, 2020 1:16 pm)
0
So added a plot statement. Now numbers are updating but are way off what they should be. MSA is showig 37 instead of 8 since last PP trigger. def signal = IsVolumeGreaterHighestDownVolume and IsPriceInTheProperRange; rec countBars = if signal then 1 else countBars[1] + 1; plot PivotDayCount= countBars;
( at June 4, 2020 1:25 pm)
0
Sorry that I forgot to include the plot statement. What you have there is not correct. I have updated my answer to include the plot statement. I just tested it for symbol MSA using the additional lines of code in my answer and it produces a value of 8. Be sure to check that your chart time frame matches the time frame selected for your watchlist column.
( at June 4, 2020 1:39 pm)
0
Thanks That worked. appreciate the help. The timeframe on the column is now set to D
( at June 4, 2020 1:44 pm)
0
Private answer

Attached is the final working  code with updated license

Marked as spam
Posted by (Questions: 5, Answers: 7)
Answered on June 4, 2020 1:45 pm