Customized Plot Based On Ticker Symbol


Category:
0
0

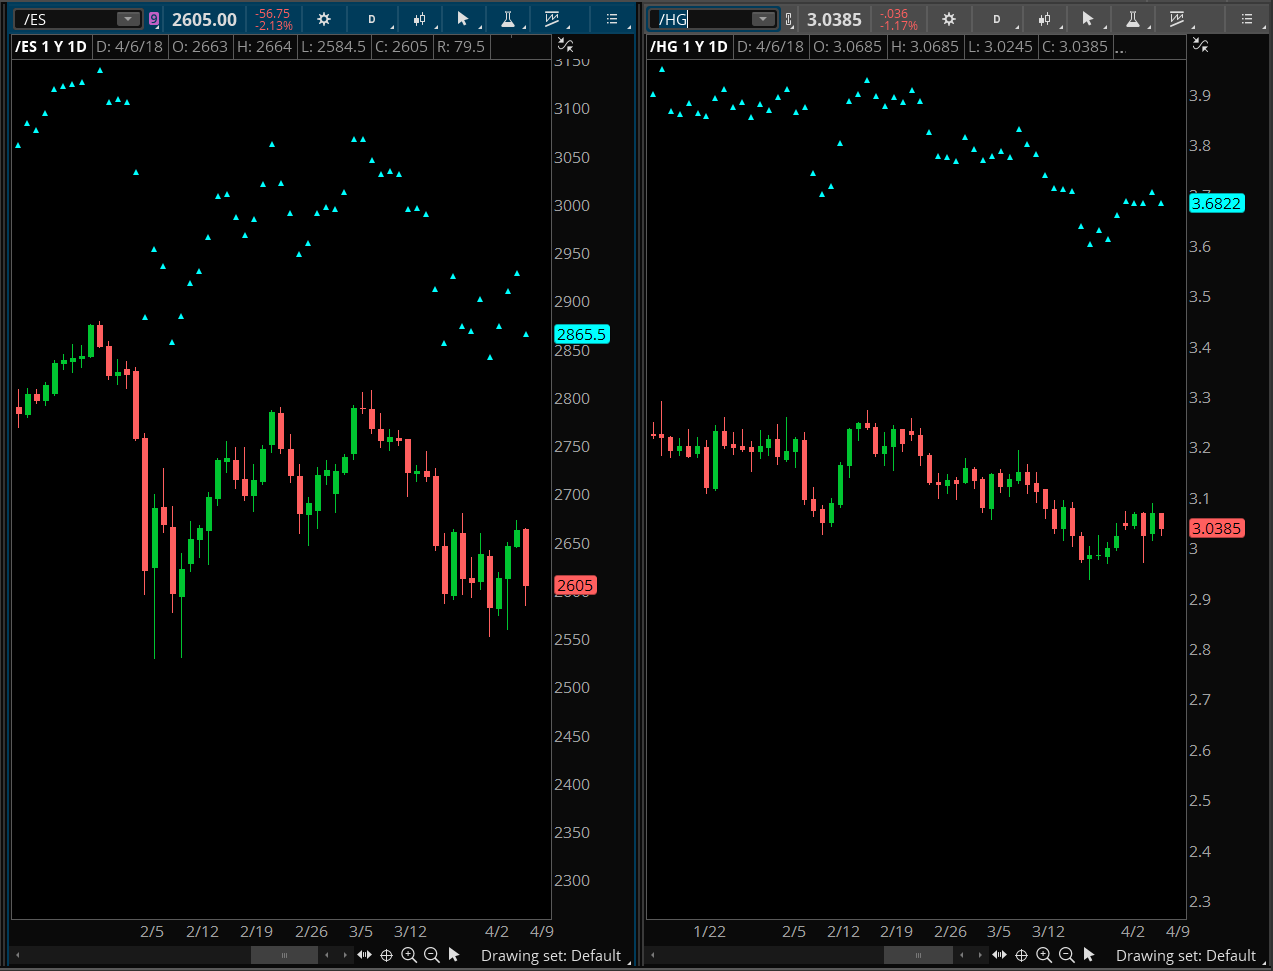
Hello, let’s say I am going through a watch list of futures,  /ES and /HG. I want the study to do something separate for each future. For example, if the ticker is /es I want a point plotted at (close * 1.1). If the ticker is /hg I want a point plotted at (high * 1.2). How would I be able to do this? Thank you!

Marked as spam
Posted by (Questions: 34, Answers: 56)
Asked on April 6, 2018 9:20 pm
76 views
0
Private answer

This can get to be really complicated depending how many more ticker symbols you want to support. This code supports the two ticker symbols you listed.

def value = if GetSymbol() == "/ES" then close * 1.1 else if GetSymbol() == "/HG" then high * 1.2 else -1;
plot point = value;
point.SetPaintingStrategy(PaintingStrategy.TRIANGLES);

Screenshot below shows how this displays for the two ticker symbols.

Attachments:
Marked as spam
Posted by (Questions: 37, Answers: 4087)
Answered on April 7, 2018 7:47 am