Display Cloud between EMA and ReverseEngineeringRSI


Category:
0
0

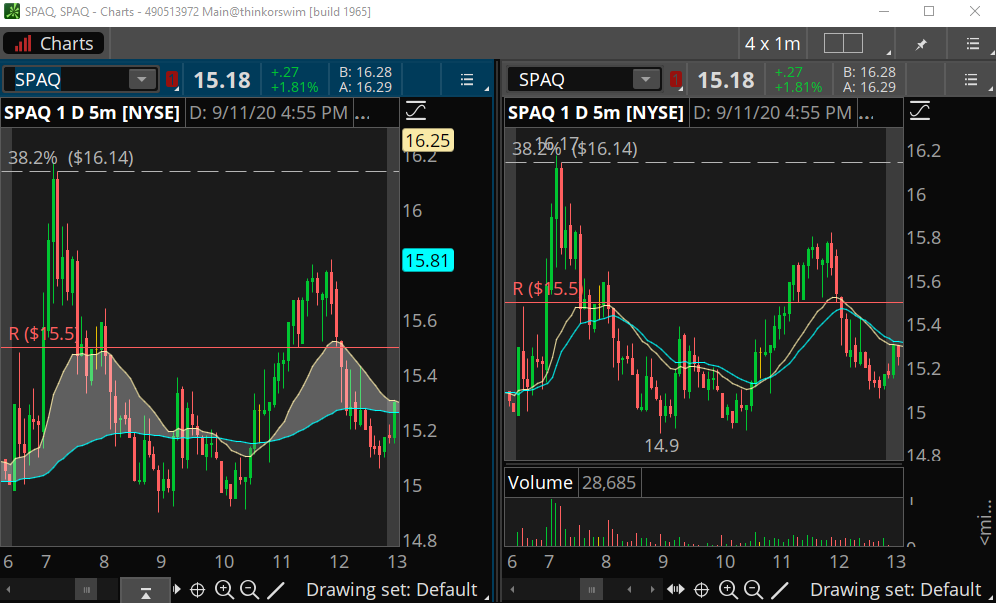
Hi Pete!

I have included an attachment for your reference. The right image is what I am looking for. It seems like my plot reverse engineer rsi code is incorrect. This is the code I am using for the left image:

plot ema20 = movAvgExponential(close, 20);
plot rvrsi50 = reverseEngineeringRSI(50);
AddCloud(ema20, rvrsi50, Color.WHITE, Color.GRAY);

Thank you!

Attachments:
Marked as spam
Posted by (Questions: 9, Answers: 4)
Asked on September 11, 2020 7:51 pm
56 views
0
Private answer

Figured it out!

Sharing here in case anyone else wants to use this as well!

plot ema20 = movAvgExponential(close, 20);
plot rvrsi50 = reverseEngineeringRSI(14, close, 50);
AddCloud(ema20, rvrsi50, Color.WHITE, Color.GRAY);

Marked as spam
Posted by (Questions: 9, Answers: 4)
Answered on September 11, 2020 7:58 pm
0
So what you discovered was that you had to include the parameters for the ReverEngineeringRSI in order to get the two charts to match. In your original attempt you only included a signal parameter, (50). When you include all three parameters is matches what you expected (14, close, 50). Just wanted to explain that for the rest of our viewers who may not be able to spot the difference or the significance of what was omitted from the first attempt.
( at September 12, 2020 8:34 am)