I updated the title of your question because it failed to describe the context of your request. How to display monthly data on a one minute chart. That is simple:
plot priceClose = close(period = AggregationPeriod.MONTH);
However that is not all what you are requesting.
Your solution is very simple. You need to make sure your 1 min chart contains sufficient data to include at least one full month of data. Which is utterly insane, but required if that's what you want. I honestly don't understand this obsession with 1 min time frames. So many folks are using that these days. In all my years of studying with the pros I never once saw any of them use a 1 min time frame. Nothing but noise down there. But, oh well.
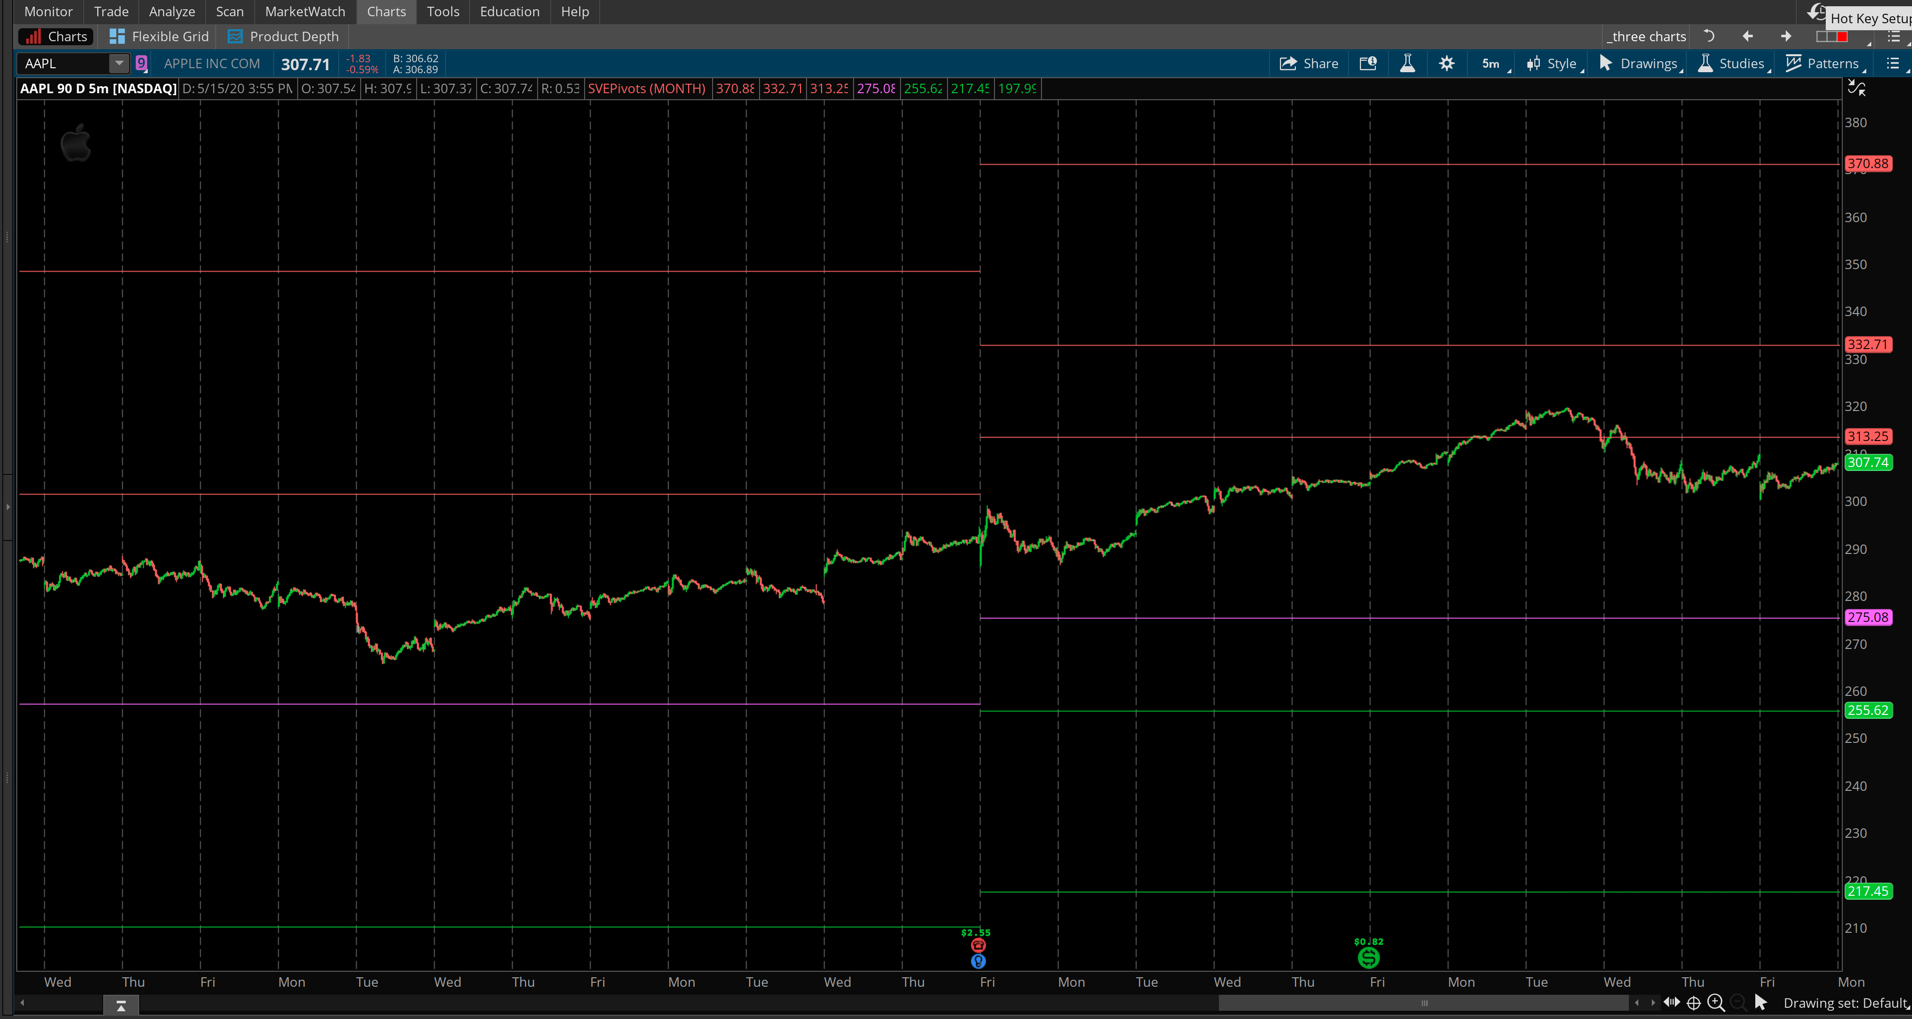
Screenshot below shows the monthly SVEPivots plotted on a 1 min chart. Note that I have set the 1 min chart to include 90 day worth of data.