Display underlying symbol and price for option


Category:
0
0

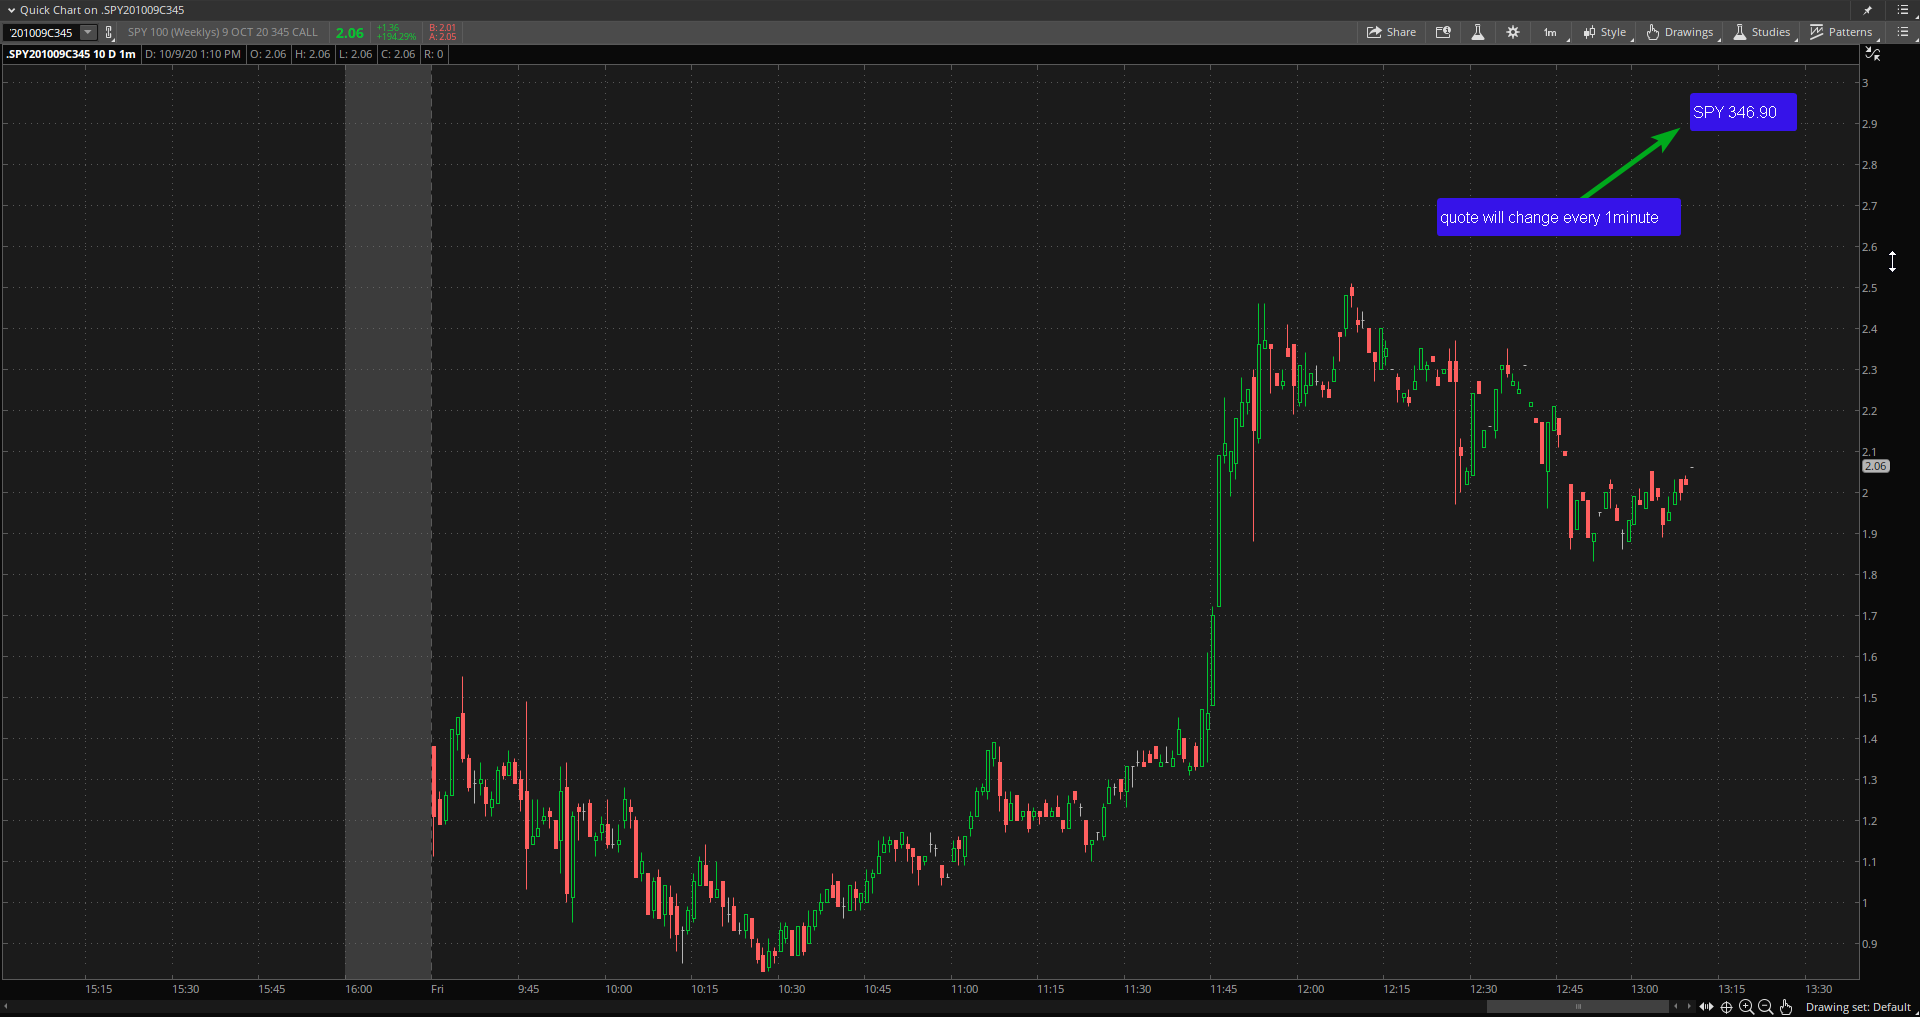
Draw a chart label displaying the underlying symbol and price for option chart. Example, when displaying a chart for .SPY201009C345 (Call option) on a 1minute Timeframe.  Display underlying symbol “SPY” and its current price

Attachments:
Marked as spam
Posted by (Questions: 12, Answers: 1)
Asked on October 9, 2020 5:05 pm
59 views
0
Private answer

Chart labels on Thinkorswim can only be displayed in the upper left-hand corner. They do not provide any method for changing the location of chart labels. Here is the code to display the label you have specified, but it will appear in the upper left-hand corner of the chart and not in the upper right-hand corner:

def underlyingPrice = close(GetUnderlyingSymbol());
AddLabel(yes, Concat(GetUnderlyingSymbol(), Concat(": ", underlyingPrice)));

FYI, The value displayed is real time. It will update in real time during live market.

Marked as spam
Posted by (Questions: 37, Answers: 4089)
Answered on October 9, 2020 6:41 pm